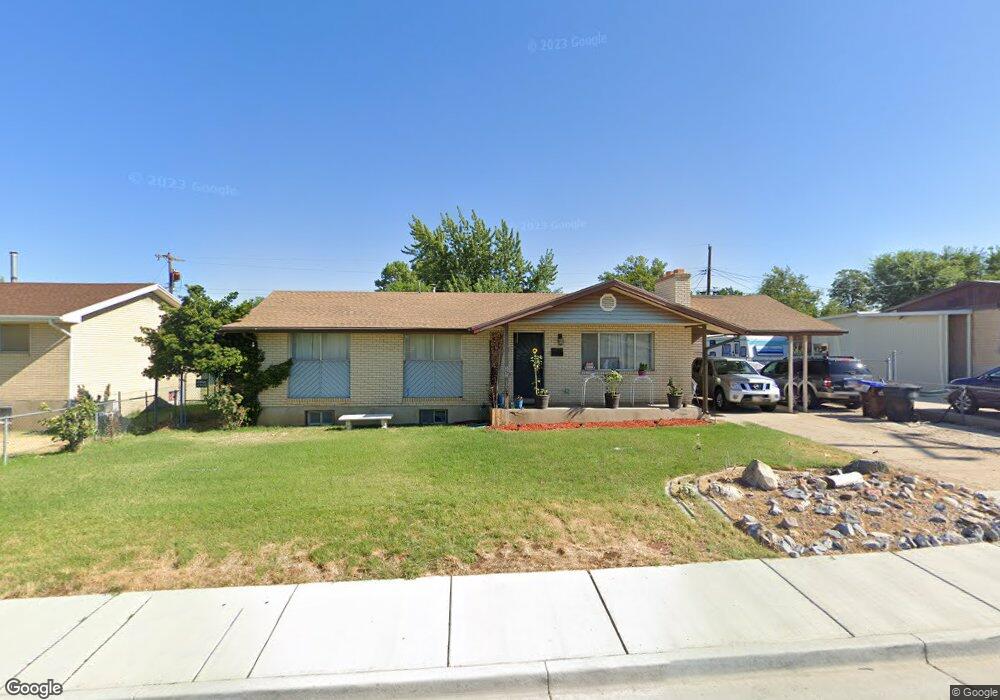
392 W 800 N Clearfield, UT 84015
Estimated Value: $352,000 - $402,000
5
Beds
2
Baths
2,250
Sq Ft
$170/Sq Ft
Est. Value
About This Home
This home is located at 392 W 800 N, Clearfield, UT 84015 and is currently estimated at $382,765, approximately $170 per square foot. 392 W 800 N is a home located in Davis County with nearby schools including Doxey School, Sunset Junior High School, and Northridge High School.
Ownership History
Date
Name
Owned For
Owner Type
Purchase Details
Closed on
Jun 3, 2019
Sold by
Udink Melanie and Uribe Melanie
Bought by
Scott Stephanie L
Current Estimated Value
Home Financials for this Owner
Home Financials are based on the most recent Mortgage that was taken out on this home.
Original Mortgage
$224,852
Outstanding Balance
$199,332
Interest Rate
4.62%
Mortgage Type
FHA
Estimated Equity
$183,433
Purchase Details
Closed on
Mar 28, 2012
Sold by
Ebeling Carol Ann
Bought by
Udink Melanie
Home Financials for this Owner
Home Financials are based on the most recent Mortgage that was taken out on this home.
Original Mortgage
$5,000
Interest Rate
3.86%
Mortgage Type
Unknown
Purchase Details
Closed on
May 13, 2011
Sold by
Ebeling Chad Wayne
Bought by
Ebeling Carol Ann
Purchase Details
Closed on
Jan 13, 2000
Sold by
King Kelly Lynn
Bought by
Ebeling Carol Ann and Ebeling Chad Wayne
Home Financials for this Owner
Home Financials are based on the most recent Mortgage that was taken out on this home.
Original Mortgage
$88,957
Interest Rate
7.84%
Mortgage Type
FHA
Create a Home Valuation Report for This Property
The Home Valuation Report is an in-depth analysis detailing your home's value as well as a comparison with similar homes in the area
Home Values in the Area
Average Home Value in this Area
Purchase History
| Date | Buyer | Sale Price | Title Company |
|---|---|---|---|
| Scott Stephanie L | -- | Old Republic Natl Title | |
| Udink Melanie | -- | First American Title | |
| Ebeling Carol Ann | -- | None Available | |
| Ebeling Carol Ann | -- | None Available | |
| Ebeling Carol Ann | -- | Guardian Title Company |
Source: Public Records
Mortgage History
| Date | Status | Borrower | Loan Amount |
|---|---|---|---|
| Open | Scott Stephanie L | $224,852 | |
| Previous Owner | Udink Melanie | $5,000 | |
| Previous Owner | Udink Melanie | $106,723 | |
| Previous Owner | Ebeling Carol Ann | $88,957 |
Source: Public Records
Tax History Compared to Growth
Tax History
| Year | Tax Paid | Tax Assessment Tax Assessment Total Assessment is a certain percentage of the fair market value that is determined by local assessors to be the total taxable value of land and additions on the property. | Land | Improvement |
|---|---|---|---|---|
| 2025 | $2,219 | $202,400 | $68,158 | $134,242 |
| 2024 | $2,008 | $183,150 | $65,111 | $118,039 |
| 2023 | $1,888 | $314,000 | $103,497 | $210,503 |
| 2022 | $2,016 | $181,500 | $58,697 | $122,803 |
| 2021 | $1,739 | $246,000 | $65,895 | $180,105 |
| 2020 | $1,524 | $212,000 | $56,104 | $155,896 |
| 2019 | $1,443 | $206,000 | $66,911 | $139,089 |
| 2018 | $1,281 | $179,000 | $53,471 | $125,529 |
| 2016 | $1,109 | $79,640 | $25,303 | $54,337 |
| 2015 | $1,025 | $69,685 | $25,303 | $44,382 |
| 2014 | $967 | $67,180 | $25,442 | $41,738 |
| 2013 | -- | $64,700 | $23,265 | $41,435 |
Source: Public Records
Map
Nearby Homes