3920 Mineola Way Unit 15 North Las Vegas, NV 89032
Cheyenne NeighborhoodEstimated Value: $379,000 - $393,000
3
Beds
2
Baths
1,208
Sq Ft
$320/Sq Ft
Est. Value
About This Home
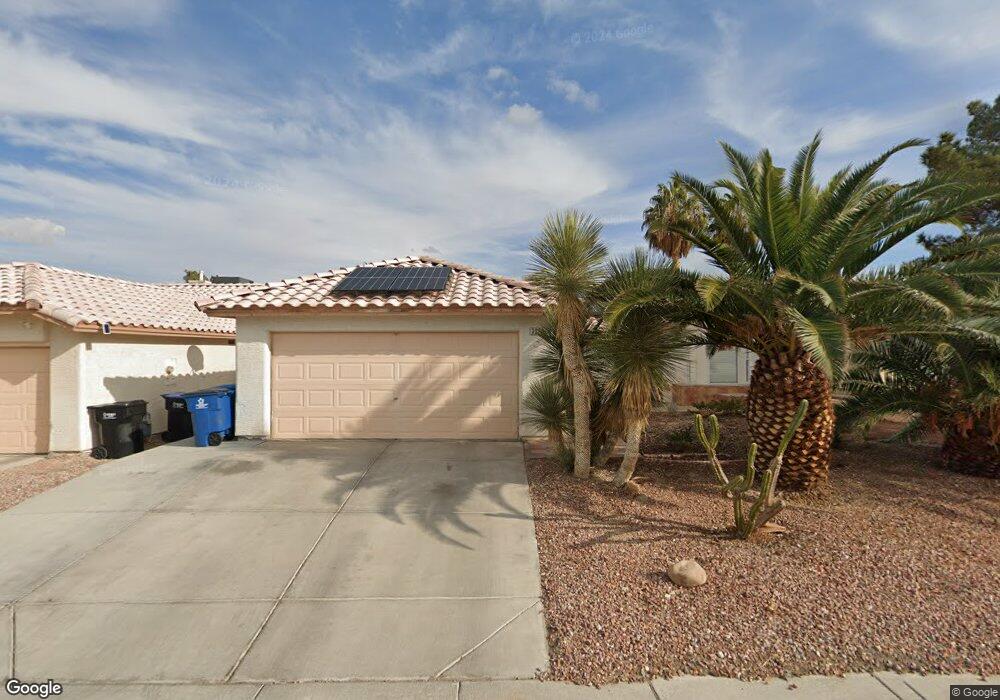
This home is located at 3920 Mineola Way Unit 15, North Las Vegas, NV 89032 and is currently estimated at $386,732, approximately $320 per square foot. 3920 Mineola Way Unit 15 is a home located in Clark County with nearby schools including Lucile Bruner Elementary School, Theron L Swainston Middle School, and Cheyenne High School.
Ownership History
Date
Name
Owned For
Owner Type
Purchase Details
Closed on
Nov 20, 2010
Sold by
Barlow Ricki Y
Bought by
Branstetter Matthew W
Current Estimated Value
Home Financials for this Owner
Home Financials are based on the most recent Mortgage that was taken out on this home.
Original Mortgage
$74,740
Outstanding Balance
$49,563
Interest Rate
4.37%
Mortgage Type
FHA
Estimated Equity
$337,169
Purchase Details
Closed on
Feb 24, 2004
Sold by
Hess Erik C and Hess Linda M
Bought by
Barlow Ricki Y
Home Financials for this Owner
Home Financials are based on the most recent Mortgage that was taken out on this home.
Original Mortgage
$177,675
Interest Rate
5.62%
Mortgage Type
FHA
Purchase Details
Closed on
Jul 20, 1995
Sold by
Pageantry Homes Corp
Bought by
Hess Erik C and Hess Linda M
Home Financials for this Owner
Home Financials are based on the most recent Mortgage that was taken out on this home.
Original Mortgage
$97,260
Interest Rate
7.59%
Mortgage Type
FHA
Create a Home Valuation Report for This Property
The Home Valuation Report is an in-depth analysis detailing your home's value as well as a comparison with similar homes in the area
Home Values in the Area
Average Home Value in this Area
Purchase History
| Date | Buyer | Sale Price | Title Company |
|---|---|---|---|
| Branstetter Matthew W | $82,000 | Titleone Henderson | |
| Barlow Ricki Y | $185,000 | Fidelity National Title | |
| Hess Erik C | $98,500 | Nevada Title Company |
Source: Public Records
Mortgage History
| Date | Status | Borrower | Loan Amount |
|---|---|---|---|
| Open | Branstetter Matthew W | $74,740 | |
| Previous Owner | Barlow Ricki Y | $177,675 | |
| Previous Owner | Hess Erik C | $97,260 | |
| Closed | Barlow Ricki Y | $10,150 |
Source: Public Records
Tax History Compared to Growth
Tax History
| Year | Tax Paid | Tax Assessment Tax Assessment Total Assessment is a certain percentage of the fair market value that is determined by local assessors to be the total taxable value of land and additions on the property. | Land | Improvement |
|---|---|---|---|---|
| 2025 | $436 | $86,237 | $28,000 | $58,237 |
| 2024 | $1,349 | $86,237 | $28,000 | $58,237 |
| 2023 | $1,349 | $85,623 | $30,450 | $55,173 |
| 2022 | $629 | $75,653 | $24,850 | $50,803 |
| 2021 | $348 | $69,401 | $21,000 | $48,401 |
| 2020 | $356 | $69,195 | $21,000 | $48,195 |
| 2019 | $518 | $65,090 | $17,500 | $47,590 |
| 2018 | $504 | $59,361 | $13,300 | $46,061 |
| 2017 | $1,069 | $59,772 | $12,950 | $46,822 |
| 2016 | $1,069 | $53,728 | $10,500 | $43,228 |
| 2015 | $267 | $40,142 | $7,000 | $33,142 |
| 2014 | $465 | $29,936 | $5,250 | $24,686 |
Source: Public Records
Map
Nearby Homes
- 3910 Cheryl Clay Way
- 3505 Benson Ln
- 3107 Atwater Dr
- 3629 Newton Falls St Unit 4
- 2801 Simmons Creek Ct
- 3614 Newton Falls St
- 3609 Simmons St
- Bellevue NextGen Plan at Simmance
- Skyland Plan at Simmance
- 3784 Nerine Pass Way
- 0 Simmons & Logan Unit 2721829
- 3938 Redfield Ave
- 3820 Alpine Track Ave
- 3809 Alpine Track Ave
- 0 Simmons & Logan 2 Unit 2722091
- 3556 Valley Lily St
- 3937 Jamison Park Ln
- 3548 Valley Lily St
- 0 Simmons & Logan 3 Unit 2722103
- 3930 Burma Rd
- 3916 Mineola Way
- 3924 Mineola Way
- 3925 Cheryl Clay Way
- 3912 Mineola Way
- 3921 Cheryl Clay Way
- 3929 Cheryl Clay Way
- 3921 Mineola Way Unit 15
- 3917 Cheryl Clay Way
- 3917 Mineola Way
- 3917 Mineola Way Unit n/a
- 3925 Mineola Way
- 3908 Mineola Way
- 3913 Mineola Way
- 3913 Cheryl Clay Way Unit 15
- 3324 Gingersnap Way
- 3320 Gingersnap Way
- 3328 Gingersnap Way
- 3316 Gingersnap Way
- 3909 Mineola Way
- 3404 Gingersnap Way