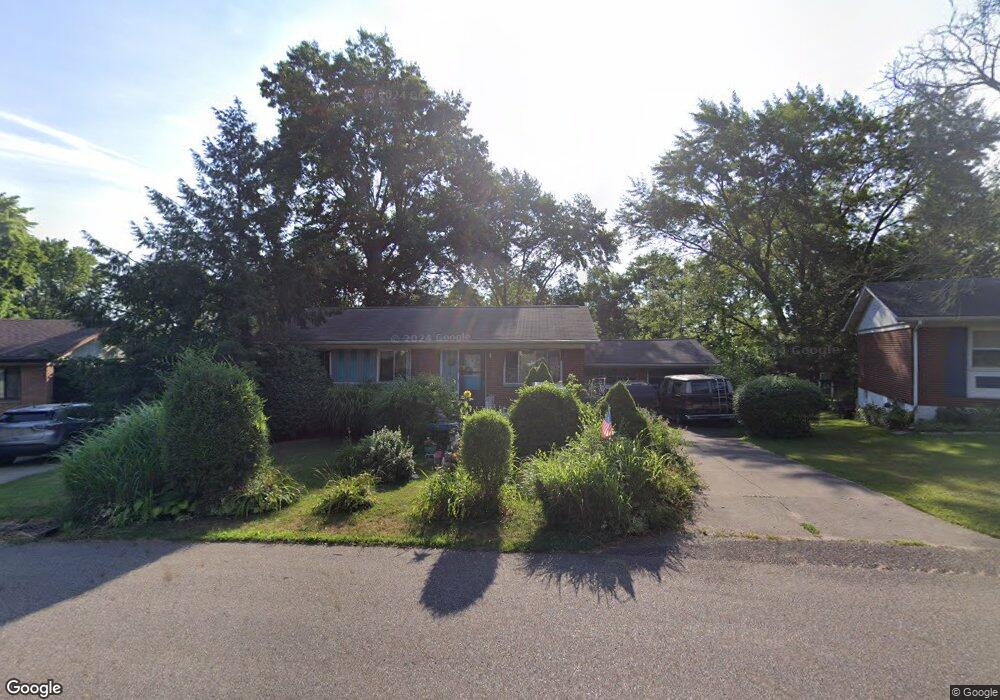
3920 Regentview St NE Canton, OH 44705
Plain Township NeighborhoodEstimated Value: $120,000 - $182,000
3
Beds
1
Bath
988
Sq Ft
$157/Sq Ft
Est. Value
About This Home
This home is located at 3920 Regentview St NE, Canton, OH 44705 and is currently estimated at $155,169, approximately $157 per square foot. 3920 Regentview St NE is a home located in Stark County with nearby schools including Ransom H. Barr Elementary School, Glenwood Intermediate School, and GlenOak High School.
Ownership History
Date
Name
Owned For
Owner Type
Purchase Details
Closed on
Dec 1, 2006
Sold by
Hickman Richard G
Bought by
Savchenko Mark S
Current Estimated Value
Purchase Details
Closed on
Jan 14, 1992
Create a Home Valuation Report for This Property
The Home Valuation Report is an in-depth analysis detailing your home's value as well as a comparison with similar homes in the area
Home Values in the Area
Average Home Value in this Area
Purchase History
| Date | Buyer | Sale Price | Title Company |
|---|---|---|---|
| Savchenko Mark S | $61,000 | Attorney | |
| -- | -- | -- |
Source: Public Records
Tax History Compared to Growth
Tax History
| Year | Tax Paid | Tax Assessment Tax Assessment Total Assessment is a certain percentage of the fair market value that is determined by local assessors to be the total taxable value of land and additions on the property. | Land | Improvement |
|---|---|---|---|---|
| 2025 | -- | $37,700 | $13,650 | $24,050 |
| 2024 | -- | $37,700 | $13,650 | $24,050 |
| 2023 | $934 | $29,190 | $8,260 | $20,930 |
| 2022 | $961 | $29,190 | $8,260 | $20,930 |
| 2021 | $965 | $29,190 | $8,260 | $20,930 |
| 2020 | $869 | $25,490 | $7,110 | $18,380 |
| 2019 | $714 | $25,490 | $7,110 | $18,380 |
| 2018 | $1,293 | $25,490 | $7,110 | $18,380 |
| 2017 | $1,257 | $22,750 | $6,160 | $16,590 |
| 2016 | $1,478 | $26,710 | $6,160 | $20,550 |
| 2015 | $1,429 | $26,710 | $6,160 | $20,550 |
| 2014 | $1,503 | $27,480 | $6,340 | $21,140 |
| 2013 | $734 | $27,480 | $6,340 | $21,140 |
Source: Public Records
Map
Nearby Homes
- 4123 Regentview St NE
- 3305 Regent Ave NE
- 4701 Roosevelt Ave NE
- 1912 40th St NE
- 1902 39th St NE
- 3022 Taft Ave NE
- 2211 48th St NE
- 2216 49th St NE
- 3023 Bollinger Ave NE
- 1852 Southpointe Cir NE Unit 39W
- 3015 Bollinger Ave NE
- 2419 Bur Oak St NE
- 1709 Southpointe Cir NE Unit 25W
- 4015 Pelham St NE Unit 3A
- 2317 Raintree St NE
- 1644 33rd St NE
- 2323 Fencegate St NE
- 0 St Elmo Ave NE Unit 5159780
- 0 St Elmo Ave NE Unit 5089961
- 1601 33rd St NE
- 3926 Regentview St NE
- 3912 Regentview St NE
- 4004 Regentview St NE
- 3911 Regentview St NE
- 3906 Regentview St NE
- 2616 Cathy Dr NE
- 3923 Regentview St NE
- 2618 41st St NE
- 2610 41st St NE
- 3901 Regentview St NE
- 2604 41st St NE
- 2610 Cathy Dr NE
- 2606 41st St NE
- 4011 Regentview St NE
- 2538 41st St NE
- 3840 Regentview St NE
- 3906 Royal Ave NE
- 2600 Cathy Dr NE
- 3910 Royal Ave NE
- 2530 41st St NE