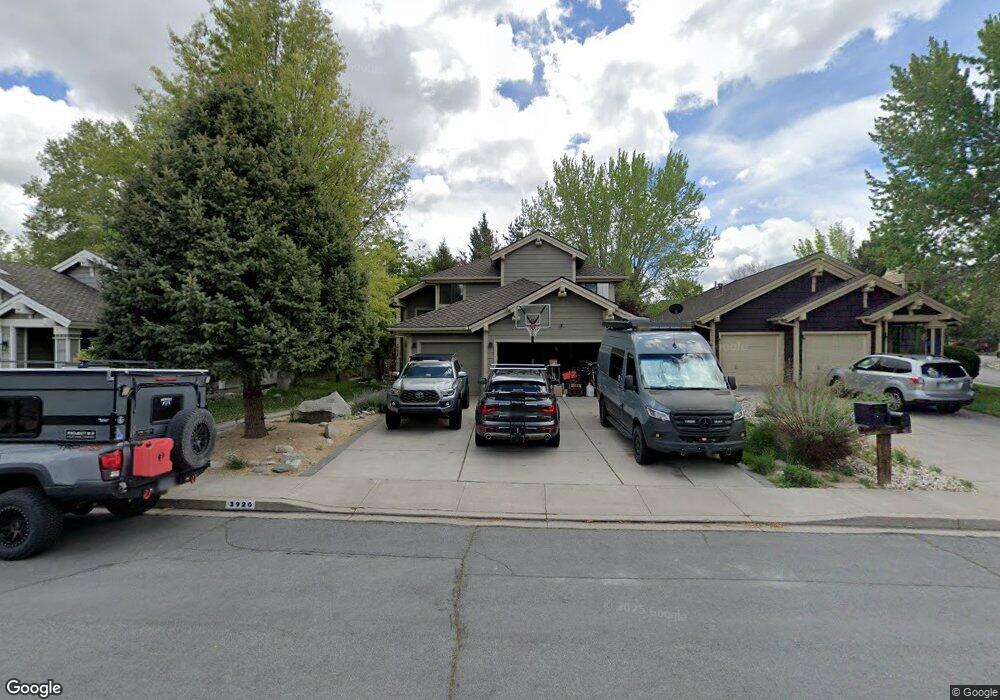
3920 Riverhaven Dr Unit 1 Reno, NV 89519
South Outer Reno NeighborhoodEstimated Value: $787,879 - $832,000
4
Beds
3
Baths
2,334
Sq Ft
$345/Sq Ft
Est. Value
About This Home
This home is located at 3920 Riverhaven Dr Unit 1, Reno, NV 89519 and is currently estimated at $805,220, approximately $344 per square foot. 3920 Riverhaven Dr Unit 1 is a home located in Washoe County with nearby schools including Roy Gomm Elementary School, Darrell C Swope Middle School, and Reno High School.
Ownership History
Date
Name
Owned For
Owner Type
Purchase Details
Closed on
Jun 3, 2004
Sold by
Oliver John R
Bought by
Angermann Jeffrey E and Angermann Teresa L
Current Estimated Value
Home Financials for this Owner
Home Financials are based on the most recent Mortgage that was taken out on this home.
Original Mortgage
$368,000
Outstanding Balance
$168,728
Interest Rate
5.4%
Mortgage Type
Unknown
Estimated Equity
$636,492
Purchase Details
Closed on
Nov 1, 2002
Sold by
Oliver Nicole A
Bought by
Oliver John R
Home Financials for this Owner
Home Financials are based on the most recent Mortgage that was taken out on this home.
Original Mortgage
$241,400
Interest Rate
5.99%
Purchase Details
Closed on
Apr 4, 2001
Sold by
Oliver John R and Oliver Nicole A
Bought by
Oliver John R and Oliver Nicole A
Purchase Details
Closed on
Sep 3, 1997
Sold by
Nyberg Roger J and Nyberg Erma J
Bought by
Oliver John R and Oliver Nicole A
Home Financials for this Owner
Home Financials are based on the most recent Mortgage that was taken out on this home.
Original Mortgage
$210,000
Interest Rate
7.42%
Mortgage Type
Seller Take Back
Create a Home Valuation Report for This Property
The Home Valuation Report is an in-depth analysis detailing your home's value as well as a comparison with similar homes in the area
Home Values in the Area
Average Home Value in this Area
Purchase History
| Date | Buyer | Sale Price | Title Company |
|---|---|---|---|
| Angermann Jeffrey E | $460,000 | First American Title | |
| Oliver John R | $241,400 | First American Title | |
| Oliver John R | -- | -- | |
| Oliver John R | $235,000 | Stewart Title |
Source: Public Records
Mortgage History
| Date | Status | Borrower | Loan Amount |
|---|---|---|---|
| Open | Angermann Jeffrey E | $368,000 | |
| Previous Owner | Oliver John R | $241,400 | |
| Previous Owner | Oliver John R | $210,000 | |
| Closed | Angermann Jeffrey E | $77,000 |
Source: Public Records
Tax History
| Year | Tax Paid | Tax Assessment Tax Assessment Total Assessment is a certain percentage of the fair market value that is determined by local assessors to be the total taxable value of land and additions on the property. | Land | Improvement |
|---|---|---|---|---|
| 2026 | -- | $121,179 | $55,685 | $65,494 |
| 2024 | $3,340 | $125,847 | $57,050 | $68,797 |
| 2023 | $3,243 | $117,327 | $51,485 | $65,842 |
| 2022 | $3,148 | $99,902 | $44,520 | $55,382 |
| 2021 | $3,055 | $87,513 | $31,885 | $55,628 |
| 2020 | $2,967 | $87,358 | $31,045 | $56,313 |
| 2019 | $2,879 | $85,208 | $29,750 | $55,458 |
| 2018 | $2,797 | $76,740 | $22,120 | $54,620 |
| 2017 | $2,694 | $76,181 | $21,665 | $54,516 |
| 2016 | $2,642 | $78,466 | $22,400 | $56,066 |
| 2015 | $2,639 | $76,155 | $19,495 | $56,660 |
| 2014 | $2,561 | $73,560 | $18,655 | $54,905 |
| 2013 | -- | $68,091 | $14,140 | $53,951 |
Source: Public Records
Map
Nearby Homes
- 3348 Current Ct
- 3322 Spring Creek Cir
- 3985 San Donato Loop
- 3318 Current Ct
- 3945 San Donato Loop
- 3990 San Donato Loop
- 1280 Bridlewood Way
- 3274 Alum Creek Ct
- 1164 Mayflower Dr
- 709 Caughlin Glen
- 4184 Del Curto Dr
- 4692 Canyon Ridge Ln Unit 3
- 4547 Canyon Ridge Ln
- 4180 Del Curto Dr
- 0000 Mccarran
- 4690 Windcrest Dr Unit 3
- 1433 Solitude Trail
- 1588 Wheatgrass Dr
- 4000 Goodsell Ln
- 4761 Scenic Hill Cir
- 3910 Riverhaven Dr
- 3930 Riverhaven Dr
- 3890 Riverhaven Dr
- 110 Edgewater Pkwy
- 3893 Streamside Ct
- 3903 Streamside Ct
- 3880 Riverhaven Dr
- 3925 Riverhaven Dr
- 3935 Riverhaven Dr
- 120 Edgewater Pkwy
- 3883 Streamside Ct
- 3915 Riverhaven Dr
- 3905 Riverhaven Dr Unit 1
- 105 Edgewater Pkwy
- 3913 Streamside Ct
- 3873 Streamside Ct
- 3955 Riverhaven Dr Unit 1
- 115 Edgewater Pkwy
- 3895 Riverhaven Dr
- 130 Edgewater Pkwy Unit 1
Your Personal Tour Guide
Ask me questions while you tour the home.