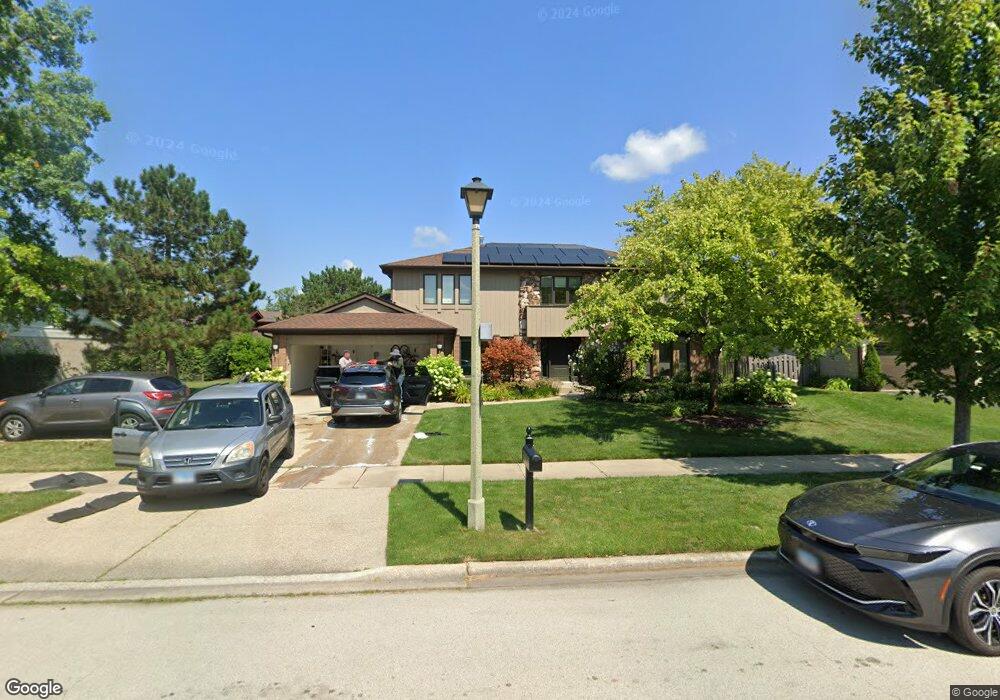
3920 Snowbird Ln Northbrook, IL 60062
Estimated Value: $1,039,835 - $1,074,000
5
Beds
3
Baths
3,146
Sq Ft
$335/Sq Ft
Est. Value
About This Home
This home is located at 3920 Snowbird Ln, Northbrook, IL 60062 and is currently estimated at $1,053,209, approximately $334 per square foot. 3920 Snowbird Ln is a home located in Cook County with nearby schools including Hickory Point Elementary School, Shabonee Elementary School, and Wood Oaks Jr High School.
Ownership History
Date
Name
Owned For
Owner Type
Purchase Details
Closed on
May 15, 2023
Sold by
Klein Steven H and Klein Jennifer B
Bought by
Kleinman Bradley and Kleinman Robin
Current Estimated Value
Home Financials for this Owner
Home Financials are based on the most recent Mortgage that was taken out on this home.
Original Mortgage
$709,600
Outstanding Balance
$689,470
Interest Rate
6.28%
Mortgage Type
New Conventional
Estimated Equity
$363,739
Purchase Details
Closed on
Jun 21, 2019
Sold by
Goldstein Nancy B
Bought by
Klein Steven H and Klein Jennifer B
Home Financials for this Owner
Home Financials are based on the most recent Mortgage that was taken out on this home.
Original Mortgage
$525,000
Interest Rate
3.75%
Mortgage Type
New Conventional
Purchase Details
Closed on
Jun 30, 1999
Sold by
Goldstein Daniel L and Goldstein Nancy B
Bought by
Goldstein Nancy B and Nancy B Goldstein Trust
Create a Home Valuation Report for This Property
The Home Valuation Report is an in-depth analysis detailing your home's value as well as a comparison with similar homes in the area
Home Values in the Area
Average Home Value in this Area
Purchase History
| Date | Buyer | Sale Price | Title Company |
|---|---|---|---|
| Kleinman Bradley | $887,000 | None Listed On Document | |
| Klein Steven H | $738,000 | Chicago Title | |
| Goldstein Nancy B | -- | -- |
Source: Public Records
Mortgage History
| Date | Status | Borrower | Loan Amount |
|---|---|---|---|
| Open | Kleinman Bradley | $709,600 | |
| Previous Owner | Klein Steven H | $525,000 |
Source: Public Records
Tax History Compared to Growth
Tax History
| Year | Tax Paid | Tax Assessment Tax Assessment Total Assessment is a certain percentage of the fair market value that is determined by local assessors to be the total taxable value of land and additions on the property. | Land | Improvement |
|---|---|---|---|---|
| 2024 | $16,487 | $74,001 | $18,098 | $55,903 |
| 2023 | $15,901 | $74,001 | $18,098 | $55,903 |
| 2022 | $15,901 | $74,001 | $18,098 | $55,903 |
| 2021 | $13,512 | $56,705 | $14,478 | $42,227 |
| 2020 | $14,142 | $56,705 | $14,478 | $42,227 |
| 2019 | $12,440 | $62,314 | $14,478 | $47,836 |
| 2018 | $10,935 | $51,553 | $12,668 | $38,885 |
| 2017 | $10,654 | $51,553 | $12,668 | $38,885 |
| 2016 | $11,588 | $57,027 | $12,668 | $44,359 |
| 2015 | $11,769 | $50,838 | $10,255 | $40,583 |
| 2014 | $11,497 | $50,838 | $10,255 | $40,583 |
| 2013 | $11,159 | $50,838 | $10,255 | $40,583 |
Source: Public Records
Map
Nearby Homes
- 4001 Walters Ave
- 3969 Maple Ave
- 3829 Eastwind Ct
- 3955 Mission Hills Rd Unit D
- 3899 Mission Hills Rd Unit 4
- 3801 Mission Hills Rd Unit 204
- 3801 Mission Hills Rd Unit 304
- 3851 Mission Hills Rd Unit 409
- 3801 Mission Hills Rd Unit 510
- 4003 Yorkshire Ln
- 1621 Mission Hills Rd Unit 104
- 3900 Mission Hills Rd Unit 407
- 1671 Mission Hills Rd Unit 302
- 1671 Mission Hills Rd Unit S
- 1671 Mission Hills Rd Unit 501
- 3741 Mission Hills Rd Unit 110
- 3741 Mission Hills Rd Unit 209
- 8 The Court of Charlwood
- 1696 Highland Ave
- 4050 Dundee Rd Unit 205K
- 3926 Snowbird Ln
- 3916 Snowbird Ln
- 3925 Raintree Ln
- 3917 Raintree Ln
- 3932 Snowbird Ln
- 3927 Snowbird Ln
- 3912 Snowbird Ln
- 3921 Snowbird Ln
- 3933 Snowbird Ln
- 3909 Raintree Ln
- 3941 Raintree Ln
- 3939 Snowbird Ln
- 3915 Snowbird Ln
- 3922 Raintree Ln
- 3918 Raintree Ln
- 3926 Raintree Ln
- 3914 Raintree Ln
- 3948 Raintree Ln
- 1335 Sunburst Ln
- 1325 Sunburst Ln