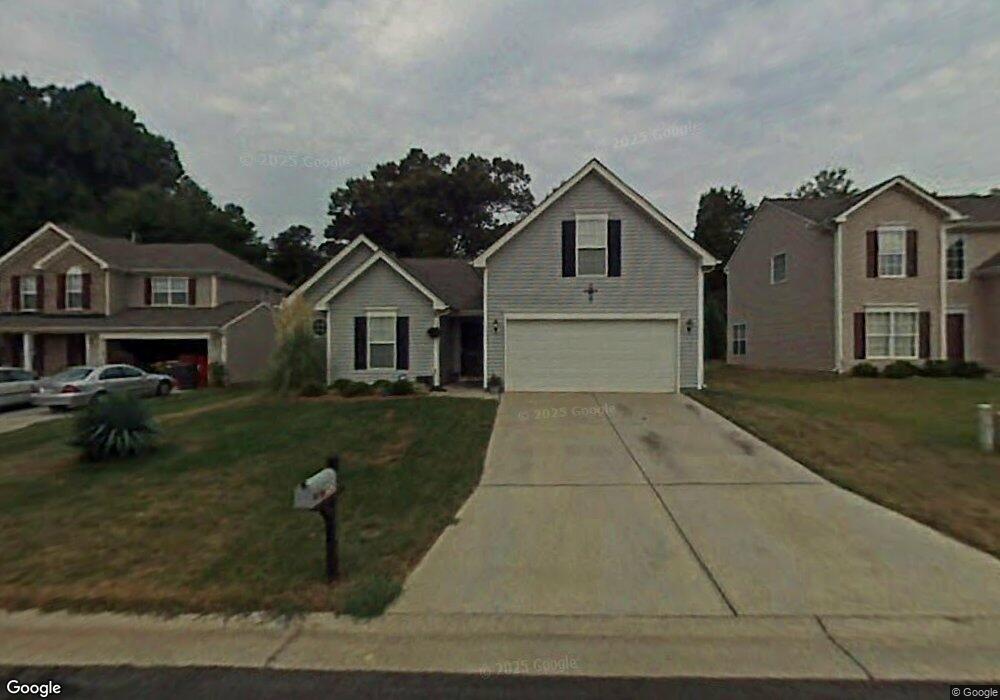
3920 Thornaby Cir Winston Salem, NC 27107
Estimated Value: $239,115 - $275,000
4
Beds
4
Baths
2,814
Sq Ft
$91/Sq Ft
Est. Value
About This Home
This home is located at 3920 Thornaby Cir, Winston Salem, NC 27107 and is currently estimated at $255,279, approximately $90 per square foot. 3920 Thornaby Cir is a home located in Forsyth County with nearby schools including Hall-Woodward Elementary School, Philo-Hill Magnet Academy, and R.B. Glenn High School.
Ownership History
Date
Name
Owned For
Owner Type
Purchase Details
Closed on
Dec 23, 2008
Sold by
Lockwood Thomas and Lockwood Sherri
Bought by
Littlejohn Brian Keith
Current Estimated Value
Home Financials for this Owner
Home Financials are based on the most recent Mortgage that was taken out on this home.
Original Mortgage
$124,358
Outstanding Balance
$82,049
Interest Rate
6.1%
Mortgage Type
FHA
Estimated Equity
$173,230
Purchase Details
Closed on
Mar 12, 2008
Sold by
Jordan Abrena Sell
Bought by
Hud
Purchase Details
Closed on
Dec 13, 2002
Sold by
The Ryland Group Inc
Bought by
Jordan Abrena Sell
Home Financials for this Owner
Home Financials are based on the most recent Mortgage that was taken out on this home.
Original Mortgage
$127,015
Interest Rate
6.08%
Mortgage Type
FHA
Create a Home Valuation Report for This Property
The Home Valuation Report is an in-depth analysis detailing your home's value as well as a comparison with similar homes in the area
Home Values in the Area
Average Home Value in this Area
Purchase History
| Date | Buyer | Sale Price | Title Company |
|---|---|---|---|
| Littlejohn Brian Keith | $126,000 | None Available | |
| Hud | $136,624 | None Available | |
| Jordan Abrena Sell | $128,500 | -- |
Source: Public Records
Mortgage History
| Date | Status | Borrower | Loan Amount |
|---|---|---|---|
| Open | Littlejohn Brian Keith | $124,358 | |
| Previous Owner | Jordan Abrena Sell | $127,015 |
Source: Public Records
Tax History Compared to Growth
Tax History
| Year | Tax Paid | Tax Assessment Tax Assessment Total Assessment is a certain percentage of the fair market value that is determined by local assessors to be the total taxable value of land and additions on the property. | Land | Improvement |
|---|---|---|---|---|
| 2025 | $1,894 | $256,000 | $33,000 | $223,000 |
| 2024 | $1,807 | $135,000 | $27,000 | $108,000 |
| 2023 | $1,807 | $135,000 | $27,000 | $108,000 |
| 2022 | $1,774 | $135,000 | $27,000 | $108,000 |
| 2021 | $1,742 | $135,000 | $27,000 | $108,000 |
| 2020 | $1,465 | $106,100 | $25,000 | $81,100 |
| 2019 | $1,476 | $106,100 | $25,000 | $81,100 |
| 2018 | $1,401 | $106,100 | $25,000 | $81,100 |
| 2016 | $1,415 | $107,459 | $23,750 | $83,709 |
| 2015 | $1,393 | $107,459 | $23,750 | $83,709 |
| 2014 | $1,351 | $107,459 | $23,750 | $83,709 |
Source: Public Records
Map
Nearby Homes
- 3514 Landis St SE
- 3520 Landis St SE
- 137 Vogler Dr
- 3532 Landis St SE
- 3538 Landis St SE
- 3544 Landis St SE
- 3422 Robindale Dr
- 0 Green Point Rd
- 3428 Robindale Dr
- 301 Bedford Park Dr
- 421 Robindale Ct
- 3435 Robindale Dr
- 3441 Robindale Dr
- 3458 Robindale Dr
- 3447 Robindale Dr
- 3453 Robindale Dr
- 3471 Robindale Dr
- 3598 Robindale Dr
- Ashe Plan at Robindale
- Erie Plan at Robindale
- 3930 Thornaby Cir
- 3910 Thornaby Cir
- 3940 Thornaby Cir
- 3885 Thornaby Cir
- 3900 Thornaby Cir
- 3950 Thornaby Cir
- 3935 Thornaby Cir
- 3875 Thornaby Cir
- 3890 Thornaby Cir
- 3945 Thornaby Cir
- 3960 Thornaby Cir
- 3880 Thornaby Cir
- 3865 Thornaby Cir
- 3955 Thornaby Cir
- 3870 Thornaby Cir
- 3970 Thornaby Cir
- 3855 Thornaby Cir
- 3860 Thornaby Cir
- 100 Denby Dr
- 3980 Thornaby Cir