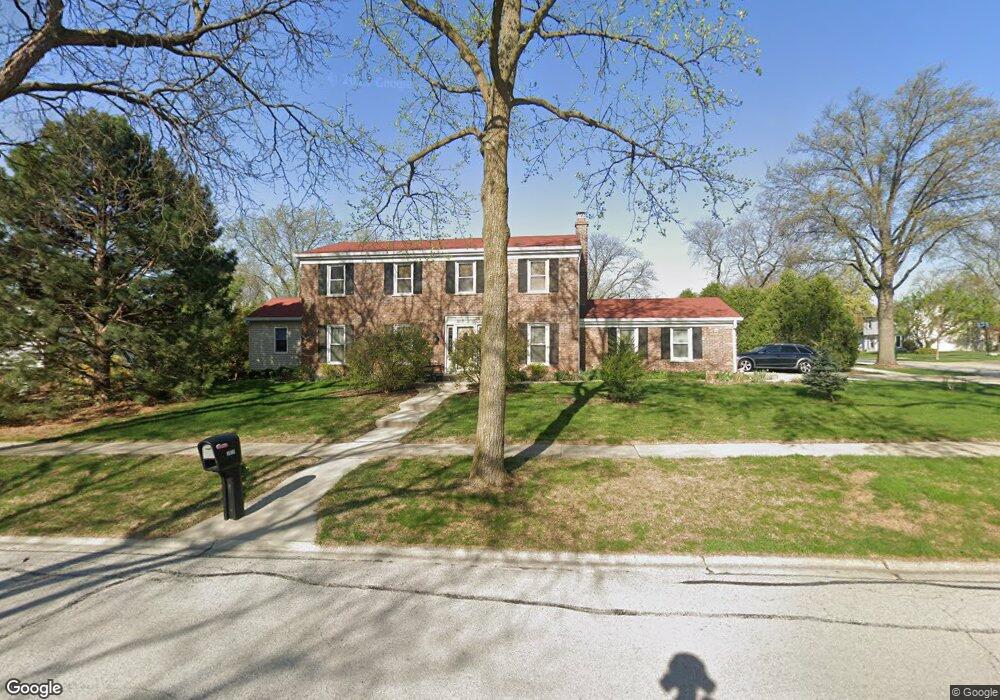
3920 W End Rd Downers Grove, IL 60515
North Westmont NeighborhoodEstimated Value: $615,704 - $671,000
--
Bed
1
Bath
2,400
Sq Ft
$266/Sq Ft
Est. Value
About This Home
This home is located at 3920 W End Rd, Downers Grove, IL 60515 and is currently estimated at $638,926, approximately $266 per square foot. 3920 W End Rd is a home located in DuPage County with nearby schools including Highland Elementary School, Herrick Middle School, and Downer Grove North High School.
Ownership History
Date
Name
Owned For
Owner Type
Purchase Details
Closed on
Jan 23, 2017
Sold by
Dewald Julius and Dewald Ingrid
Bought by
Dewald Julius P A and Dewald Ingrid F
Current Estimated Value
Purchase Details
Closed on
Apr 29, 1999
Sold by
Chase Korin Timothy S and Chase Korin Susan
Bought by
Dewald Julius and Dewald Ingril
Home Financials for this Owner
Home Financials are based on the most recent Mortgage that was taken out on this home.
Original Mortgage
$209,000
Outstanding Balance
$54,046
Interest Rate
7.05%
Estimated Equity
$584,880
Purchase Details
Closed on
Nov 30, 1993
Sold by
Mears Frank H and Mears Tyra S
Bought by
Chase Korin Timothy and Chase Korin Susan
Home Financials for this Owner
Home Financials are based on the most recent Mortgage that was taken out on this home.
Original Mortgage
$160,000
Interest Rate
6.95%
Create a Home Valuation Report for This Property
The Home Valuation Report is an in-depth analysis detailing your home's value as well as a comparison with similar homes in the area
Home Values in the Area
Average Home Value in this Area
Purchase History
| Date | Buyer | Sale Price | Title Company |
|---|---|---|---|
| Dewald Julius P A | -- | Attorney | |
| Dewald Julius | $262,000 | First American Title Ins | |
| Chase Korin Timothy | $215,000 | Attorneys Title Guaranty Fun |
Source: Public Records
Mortgage History
| Date | Status | Borrower | Loan Amount |
|---|---|---|---|
| Open | Dewald Julius | $209,000 | |
| Previous Owner | Chase Korin Timothy | $160,000 |
Source: Public Records
Tax History Compared to Growth
Tax History
| Year | Tax Paid | Tax Assessment Tax Assessment Total Assessment is a certain percentage of the fair market value that is determined by local assessors to be the total taxable value of land and additions on the property. | Land | Improvement |
|---|---|---|---|---|
| 2024 | $9,496 | $190,757 | $71,273 | $119,484 |
| 2023 | $8,987 | $175,360 | $65,520 | $109,840 |
| 2022 | $9,124 | $161,020 | $62,940 | $98,080 |
| 2021 | $8,539 | $159,180 | $62,220 | $96,960 |
| 2020 | $8,382 | $156,030 | $60,990 | $95,040 |
| 2019 | $8,116 | $149,710 | $58,520 | $91,190 |
| 2018 | $7,783 | $142,180 | $58,160 | $84,020 |
| 2017 | $7,537 | $136,820 | $55,970 | $80,850 |
| 2016 | $7,388 | $130,580 | $53,420 | $77,160 |
| 2015 | $7,308 | $122,850 | $50,260 | $72,590 |
| 2014 | $7,097 | $116,090 | $48,870 | $67,220 |
| 2013 | $6,952 | $115,550 | $48,640 | $66,910 |
Source: Public Records
Map
Nearby Homes
- 3916 Liberty Blvd
- 3811 N Park St
- 3931 Liberty Blvd
- 248 41st St
- 4218 Florence Ave
- 4022 N Grant St
- 2919 35th St
- 4111 Douglas Rd
- 4010 N Cass Ave
- 3412 Meyers Rd
- 2605 35th St
- Lot 3910 Sterling Rd
- 4117 Sterling Rd
- 3730 Sterling Rd
- 425 Sherman St
- 525 36th St
- 500 N Grant St
- 3220 Meyers Rd
- 475 N Cass Ave Unit 212
- 3919 Washington St