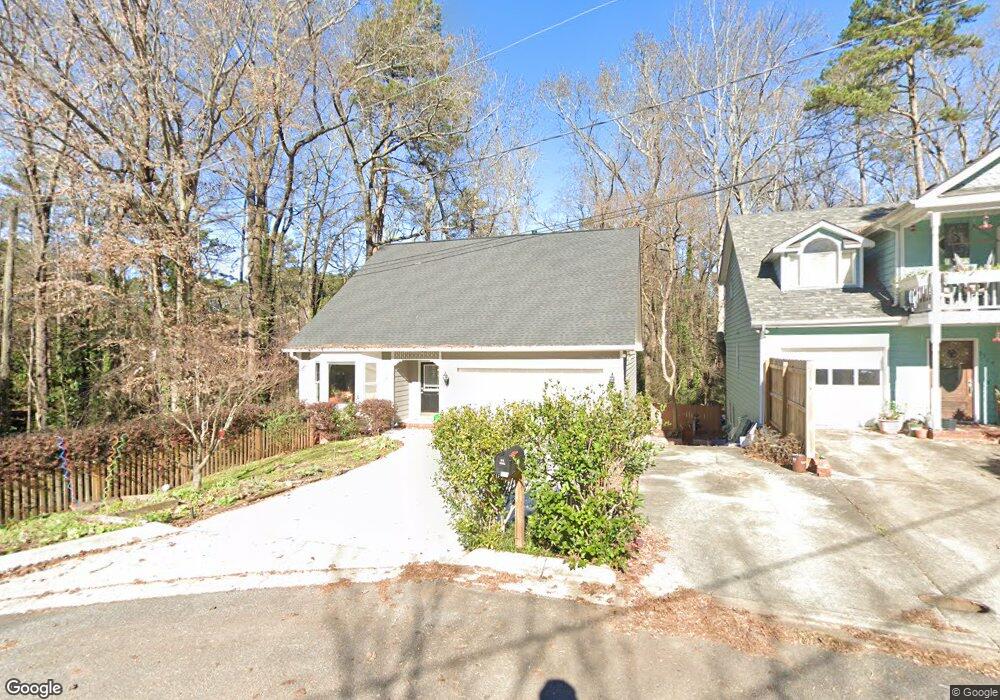
3920 Williams St Clarkston, GA 30021
Estimated Value: $366,000 - $407,000
3
Beds
3
Baths
1,950
Sq Ft
$197/Sq Ft
Est. Value
About This Home
This home is located at 3920 Williams St, Clarkston, GA 30021 and is currently estimated at $383,360, approximately $196 per square foot. 3920 Williams St is a home located in DeKalb County with nearby schools including Jolly Elementary School, Freedom Middle School, and Clarkston High School.
Ownership History
Date
Name
Owned For
Owner Type
Purchase Details
Closed on
Feb 14, 2022
Sold by
Horner Tony F
Bought by
Atwood Brooke
Current Estimated Value
Home Financials for this Owner
Home Financials are based on the most recent Mortgage that was taken out on this home.
Original Mortgage
$219,500
Outstanding Balance
$203,434
Interest Rate
3.55%
Mortgage Type
Cash
Estimated Equity
$179,926
Purchase Details
Closed on
Mar 16, 2007
Sold by
Anderson Cynthia S
Bought by
Horner Tony F
Home Financials for this Owner
Home Financials are based on the most recent Mortgage that was taken out on this home.
Original Mortgage
$158,300
Interest Rate
6%
Mortgage Type
New Conventional
Purchase Details
Closed on
Apr 30, 2002
Sold by
Kornahrens Scott E
Bought by
Anderson Cynthia S
Home Financials for this Owner
Home Financials are based on the most recent Mortgage that was taken out on this home.
Original Mortgage
$165,500
Interest Rate
6.12%
Mortgage Type
New Conventional
Purchase Details
Closed on
Feb 8, 2000
Sold by
Kornahrens Eleanor A
Bought by
Kornahrens Scott E
Create a Home Valuation Report for This Property
The Home Valuation Report is an in-depth analysis detailing your home's value as well as a comparison with similar homes in the area
Home Values in the Area
Average Home Value in this Area
Purchase History
| Date | Buyer | Sale Price | Title Company |
|---|---|---|---|
| Atwood Brooke | -- | -- | |
| Horner Tony F | $197,900 | -- | |
| Anderson Cynthia S | $165,500 | -- | |
| Kornahrens Scott E | -- | -- |
Source: Public Records
Mortgage History
| Date | Status | Borrower | Loan Amount |
|---|---|---|---|
| Open | Atwood Brooke | $219,500 | |
| Previous Owner | Horner Tony F | $158,300 | |
| Previous Owner | Anderson Cynthia S | $165,500 |
Source: Public Records
Tax History Compared to Growth
Tax History
| Year | Tax Paid | Tax Assessment Tax Assessment Total Assessment is a certain percentage of the fair market value that is determined by local assessors to be the total taxable value of land and additions on the property. | Land | Improvement |
|---|---|---|---|---|
| 2025 | $4,225 | $135,000 | $26,000 | $109,000 |
| 2024 | $4,217 | $126,920 | $26,000 | $100,920 |
| 2023 | $4,217 | $123,760 | $26,000 | $97,760 |
| 2022 | $3,290 | $116,760 | $20,000 | $96,760 |
| 2021 | $2,740 | $92,960 | $20,000 | $72,960 |
| 2020 | $2,330 | $74,960 | $9,440 | $65,520 |
| 2019 | $2,280 | $73,680 | $9,440 | $64,240 |
| 2018 | $1,935 | $65,240 | $9,440 | $55,800 |
| 2017 | $2,016 | $59,320 | $9,440 | $49,880 |
| 2016 | $1,882 | $56,520 | $9,440 | $47,080 |
| 2014 | $1,236 | $37,840 | $9,480 | $28,360 |
Source: Public Records
Map
Nearby Homes
- 1172 Denison Dr
- 3816 Prescott Ridge Cir Unit 30
- 1310 Brockett Place
- 1362 Brockett Place Unit 1362
- 1297 Tree Creek Ct
- 4549 Erskine Rd
- 3647 Cobble Mill Ln Unit Ste B4
- 957 Texel Ln Unit 4
- 1111 Gunnison Ct Unit 4
- 3965 Camelot Ct
- 1186 Vaughan St
- 1367 Wenlock Edge Cove
- 4074 Idlevale Dr
- 3722 S Marlborough Dr
- 1092 Alpco Ct
- 1399 Sagewood Cir
- 4191 Central Dr
- 907 E Green Ln
- 3819 Cottage Cir
- 4166 Idlevale Dr
- 3924 Williams St
- 3928 Williams St
- 3932 Williams St Unit 2
- 3902 Williams St
- 3925 Williams St
- 1245 Courtney Ln
- 3939 Back Trail
- 1253 Courtney Ln Unit 2
- 3929 Williams St
- 3933 Williams St
- 1259 Courtney Ln
- 3940 Williams St
- 1254 Melrose Dr
- 0 Williams St Unit 7326554
- 0 Williams St Unit 3201875
- 0 Williams St Unit 8269612
- 0 Williams St Unit 7618372
- 3894 Williams St
- 3897 Williams St
- 3945 Back Trail