3921 Beech St Cincinnati, OH 45227
Estimated Value: $164,000 - $259,000
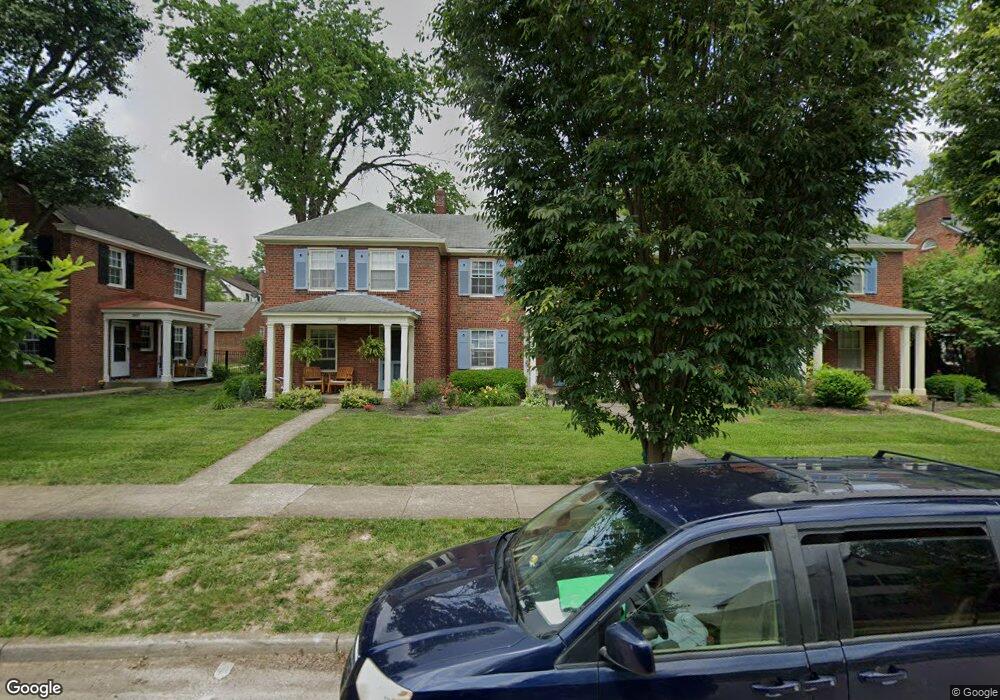
About This Home
Property Id: 895130
Historic Mariemont is THE BEST PLACE to live w walkability, biking, movie theatre, Graeter's ice cream, shopping, restaurants, Krogers, tennis and pools, own government + fire and police departments. Close to I-71, Downtown, Hyde Park, Oakley. Village fireworks and parades. Peaceful location for enjoying your morning coffee on the patio, with great neighbors. 1st floor has living room, dining room + gorgeous remodeled kitchen w stainless steel gas stove, microwave, refrig, dw, W/D. 2 bd/1 bth on 2nd level. Attic storage; brightly painted lower level w lots of storage, usable for exercise hobbies, man-cave, or office. Refinished hardwood floors, mini-blinds throughout. Update ceiling fans. Includes Patio and Garage included. No dogs. No smokers inside or outside. Available 7/31. Close to I-71, Hyde Park, Oakley. Tree City USA. Sorry no dogs, no smokers inside or outside. Good credit is needed. Call Karen to view. Please fill out prescreen form first.
Home Values in the Area
Average Home Value in this Area
Property History
| Date | Event | Price | List to Sale | Price per Sq Ft |
|---|---|---|---|---|
| 10/06/2025 10/06/25 | Off Market | $1,795 | -- | -- |
| 09/21/2025 09/21/25 | For Rent | $1,795 | 0.0% | -- |
| 09/17/2025 09/17/25 | Off Market | $1,795 | -- | -- |
| 08/31/2025 08/31/25 | For Rent | $1,795 | 0.0% | -- |
| 08/20/2025 08/20/25 | Off Market | $1,795 | -- | -- |
| 08/04/2025 08/04/25 | Price Changed | $1,795 | -5.3% | $2 / Sq Ft |
| 07/07/2025 07/07/25 | Price Changed | $1,895 | -2.8% | $2 / Sq Ft |
| 07/04/2025 07/04/25 | For Rent | $1,950 | -- | -- |
Tax History
| Year | Tax Paid | Tax Assessment Tax Assessment Total Assessment is a certain percentage of the fair market value that is determined by local assessors to be the total taxable value of land and additions on the property. | Land | Improvement |
|---|---|---|---|---|
| 2025 | $2,236 | $30,913 | $5,961 | $24,952 |
| 2023 | $2,037 | $30,913 | $5,961 | $24,952 |
| 2022 | $2,541 | $32,757 | $6,983 | $25,774 |
| 2021 | $2,528 | $32,757 | $6,983 | $25,774 |
| 2020 | $2,494 | $32,757 | $6,983 | $25,774 |
| 2019 | $2,410 | $28,735 | $6,125 | $22,610 |
| 2018 | $2,407 | $28,735 | $6,125 | $22,610 |
| 2017 | $2,086 | $28,735 | $6,125 | $22,610 |
| 2016 | $2,040 | $27,475 | $4,025 | $23,450 |
| 2015 | $2,032 | $27,475 | $4,025 | $23,450 |
| 2014 | $2,030 | $27,475 | $4,025 | $23,450 |
| 2013 | $1,682 | $23,891 | $3,500 | $20,391 |
Map
- 3723 Carlton Ave
- 6613 Bramble Ave
- 6307 Wooster Pike
- 3730 Simpson Ave
- 3645 Birkdale Ln
- 6208 Bancroft St
- 3669 Birkdale Ln
- 3662 Birkdale Ln
- 3665 Birkdale Ln
- 3715 Simpson Ave
- 3657 Birkdale Ln
- 3653 Birkdale Ln
- 3649 Birkdale Ln
- 3641 Birkdale Ln
- 3710 Watterson Rd
- 4115 Homer Ave
- 6497 Merwin Ave
- 3910 Germania St
- 6017 Bramble Ave
- 6949 Cambridge Ave
- 3919 Beech St
- 3919 Beech St
- 3919 Beech St
- 3923 Beech St
- 3925 Beech St
- 3917 Beech St
- 3929 Beech St
- 3931 Beech St
- 3933 Beech St
- 3935 Beech St
- 3909 Beech St Unit 3917
- 3909 Beech St
- 3937 Beech St
- 3856 Homewood Rd
- 3854 Homewood Rd
- 3926 Beech St
- 3928 Beech St
- 3848 Homewood Rd
- 3858 Homewood Rd
- 3932 Beech St
Ask me questions while you tour the home.