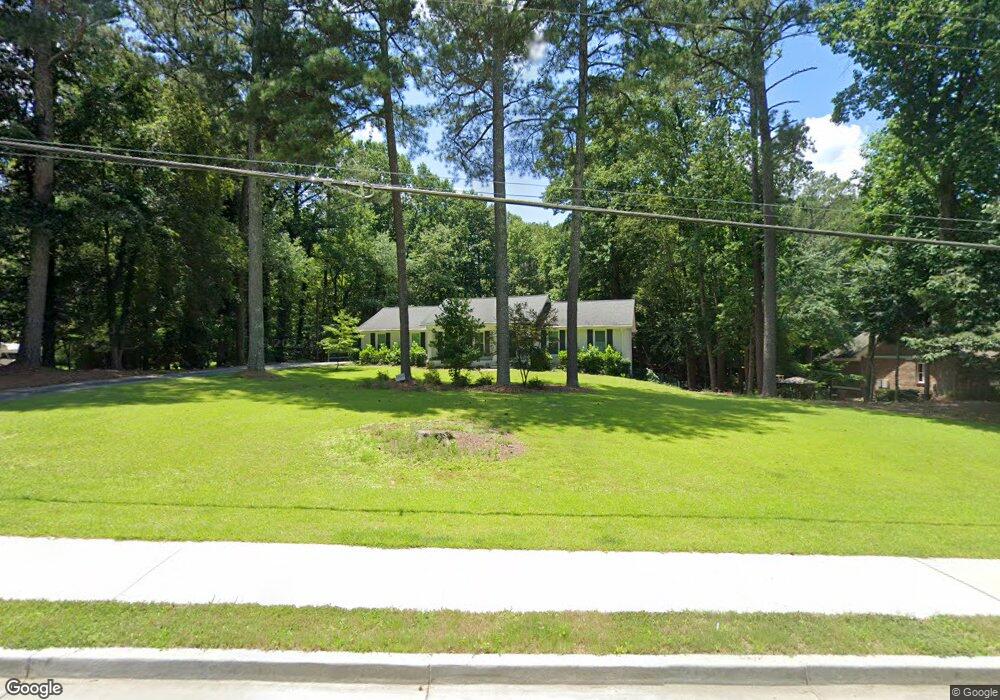
3921 Gunnin Rd Norcross, GA 30092
Estimated Value: $533,916 - $614,000
3
Beds
2
Baths
1,637
Sq Ft
$354/Sq Ft
Est. Value
About This Home
This home is located at 3921 Gunnin Rd, Norcross, GA 30092 and is currently estimated at $580,229, approximately $354 per square foot. 3921 Gunnin Rd is a home located in Gwinnett County with nearby schools including Simpson Elementary School, Pinckneyville Middle School, and Norcross High School.
Ownership History
Date
Name
Owned For
Owner Type
Purchase Details
Closed on
May 25, 2012
Sold by
Hart Richard E
Bought by
Hart Richard E and Hart Christie C
Current Estimated Value
Home Financials for this Owner
Home Financials are based on the most recent Mortgage that was taken out on this home.
Original Mortgage
$254,600
Outstanding Balance
$175,606
Interest Rate
3.88%
Mortgage Type
FHA
Estimated Equity
$404,623
Purchase Details
Closed on
Feb 23, 2010
Sold by
Bodin Callie F
Bought by
Hart Richard E
Home Financials for this Owner
Home Financials are based on the most recent Mortgage that was taken out on this home.
Original Mortgage
$260,200
Interest Rate
4.94%
Mortgage Type
FHA
Purchase Details
Closed on
Nov 20, 2008
Sold by
Parker Eula G
Bought by
Bodin Callie F and Scott Bodin B
Home Financials for this Owner
Home Financials are based on the most recent Mortgage that was taken out on this home.
Original Mortgage
$194,000
Interest Rate
6.1%
Mortgage Type
FHA
Create a Home Valuation Report for This Property
The Home Valuation Report is an in-depth analysis detailing your home's value as well as a comparison with similar homes in the area
Home Values in the Area
Average Home Value in this Area
Purchase History
| Date | Buyer | Sale Price | Title Company |
|---|---|---|---|
| Hart Richard E | -- | -- | |
| Hart Richard E | $265,000 | -- | |
| Bodin Callie F | $200,000 | -- |
Source: Public Records
Mortgage History
| Date | Status | Borrower | Loan Amount |
|---|---|---|---|
| Open | Hart Richard E | $254,600 | |
| Previous Owner | Hart Richard E | $260,200 | |
| Previous Owner | Bodin Callie F | $194,000 |
Source: Public Records
Tax History Compared to Growth
Tax History
| Year | Tax Paid | Tax Assessment Tax Assessment Total Assessment is a certain percentage of the fair market value that is determined by local assessors to be the total taxable value of land and additions on the property. | Land | Improvement |
|---|---|---|---|---|
| 2025 | $5,052 | $181,560 | $38,360 | $143,200 |
| 2024 | $4,995 | $173,320 | $50,800 | $122,520 |
| 2023 | $4,995 | $153,680 | $44,400 | $109,280 |
| 2022 | $4,272 | $138,080 | $36,360 | $101,720 |
| 2021 | $3,870 | $115,120 | $35,800 | $79,320 |
| 2020 | $3,893 | $115,120 | $35,800 | $79,320 |
| 2019 | $3,617 | $107,560 | $30,480 | $77,080 |
| 2018 | $3,628 | $107,560 | $30,480 | $77,080 |
| 2016 | $3,224 | $90,840 | $24,360 | $66,480 |
| 2015 | $3,259 | $90,840 | $24,360 | $66,480 |
| 2014 | $3,139 | $90,840 | $24,360 | $66,480 |
Source: Public Records
Map
Nearby Homes
- 3962 Gunnin Rd
- 3922 Glen Meadow Dr
- 4053 Spalding Hollow NW
- 4102 Ailey Ct
- 5786 Broxton Cir
- 3910 Spalding Bluff Dr
- 3723 Orchard St
- 507 Peachtree Forest Terrace
- 6027 Peachmont Terrace
- 601 Peachtree Forest Ave
- 5885 Match Point
- 4944 Sealy Cir
- 4965 Sealy Cir
- 6169 Poplar Bluff Cir
- 3553 Corners Way
- 4570 Waterside Pkwy
- 3710 Wedgewood Chase Unit 22
- 5649 Whitesburg Ct
- 3931 Gunnin Rd
- 3911 Gunnin Rd
- 3951 Gunnin Rd
- 3924 Gunnin Rd
- 3914 Gunnin Rd
- 3902 Gunnin Rd
- 3932 Gunnin Rd
- 0 Add Ct NW Unit 8184720
- 0 Add Ct NW
- 3973 Spalding Hollow
- 3971 Gunnin Rd
- 3892 Gunnin Rd
- 3894 Gunnin Rd
- 3894 Gunnin Rd Unit 2
- 3891 Gunnin Rd
- 3942 Gunnin Rd
- 3983 Spalding Hollow
- 3922 Centre Ct Unit 3
- 3912 Centre Ct Unit 3
- 3902 Centre Ct Unit 3