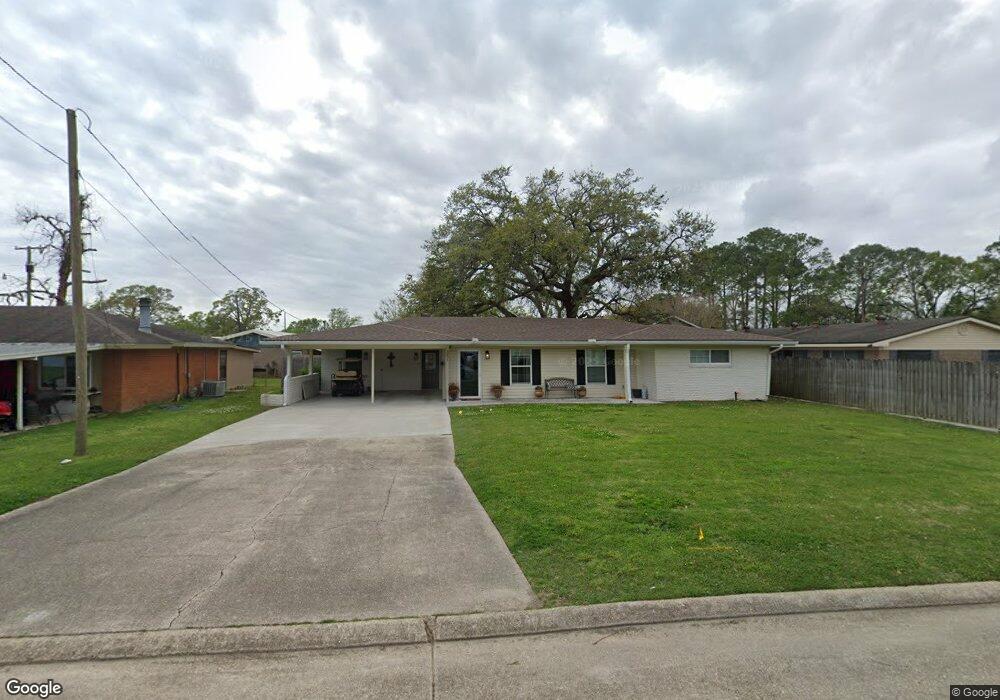
3921 John St Berwick, LA 70342
Estimated Value: $154,000 - $207,000
Studio
--
Bath
--
Sq Ft
7,841
Sq Ft
About This Home
This home is located at 3921 John St, Berwick, LA 70342 and is currently estimated at $181,834. 3921 John St is a home located in St. Mary Parish with nearby schools including Berwick Elementary School, Berwick Junior High School, and Berwick High School.
Ownership History
Date
Name
Owned For
Owner Type
Purchase Details
Closed on
Sep 15, 2021
Sold by
Hardaway Russell L and Davis-Hardaway Leslie
Bought by
Boudreaux Paige D
Current Estimated Value
Home Financials for this Owner
Home Financials are based on the most recent Mortgage that was taken out on this home.
Original Mortgage
$176,739
Outstanding Balance
$159,152
Interest Rate
2.7%
Mortgage Type
FHA
Estimated Equity
$22,682
Purchase Details
Closed on
Sep 14, 2020
Sold by
Thomas-Boudreaux Mary A
Bought by
Hardaway Russell L
Create a Home Valuation Report for This Property
The Home Valuation Report is an in-depth analysis detailing your home's value as well as a comparison with similar homes in the area
Home Values in the Area
Average Home Value in this Area
Purchase History
| Date | Buyer | Sale Price | Title Company |
|---|---|---|---|
| Boudreaux Paige D | $180,000 | None Available | |
| Hardaway Russell L | $14,200 | None Available |
Source: Public Records
Mortgage History
| Date | Status | Borrower | Loan Amount |
|---|---|---|---|
| Open | Boudreaux Paige D | $176,739 |
Source: Public Records
Tax History
| Year | Tax Paid | Tax Assessment Tax Assessment Total Assessment is a certain percentage of the fair market value that is determined by local assessors to be the total taxable value of land and additions on the property. | Land | Improvement |
|---|---|---|---|---|
| 2025 | $1,754 | $17,194 | $1,600 | $15,594 |
| 2024 | $1,599 | $17,194 | $1,600 | $15,594 |
| 2023 | $1,244 | $17,194 | $1,600 | $15,594 |
| 2022 | $1,596 | $17,194 | $1,600 | $15,594 |
| 2021 | $1,602 | $17,194 | $1,600 | $15,594 |
| 2020 | $520 | $5,548 | $1,424 | $4,124 |
| 2019 | $477 | $5,315 | $1,424 | $3,891 |
| 2018 | $477 | $5,315 | $1,424 | $3,891 |
| 2017 | $477 | $5,315 | $1,424 | $3,891 |
| 2016 | $377 | $5,315 | $1,424 | $3,891 |
| 2015 | $99 | $5,239 | $1,424 | $3,815 |
| 2014 | $99 | $5,239 | $1,424 | $3,815 |
| 2013 | $99 | $5,239 | $1,424 | $3,815 |
Source: Public Records
Map
Nearby Homes
- 4012 John St
- 1030 2nd St
- 1513 Nevada St
- 1420 N 3rd St
- 1648 N 2nd St
- 1510 N 3rd St
- 1215 Federal Ave
- 1513 Ellzey St
- 512 Marshall St
- 909 Fourth St
- 922 Fourth St
- 920 Fourth St
- 417 Leona St
- 697 Victoria Dr
- 510 Renwick Blvd
- 616 Federal Ave
- 603 Point Pleasant Dr
- 302 Riverside Dr
- 606 Point Pleasant Dr
- 616 Grove St Unit 1
Your Personal Tour Guide
Ask me questions while you tour the home.