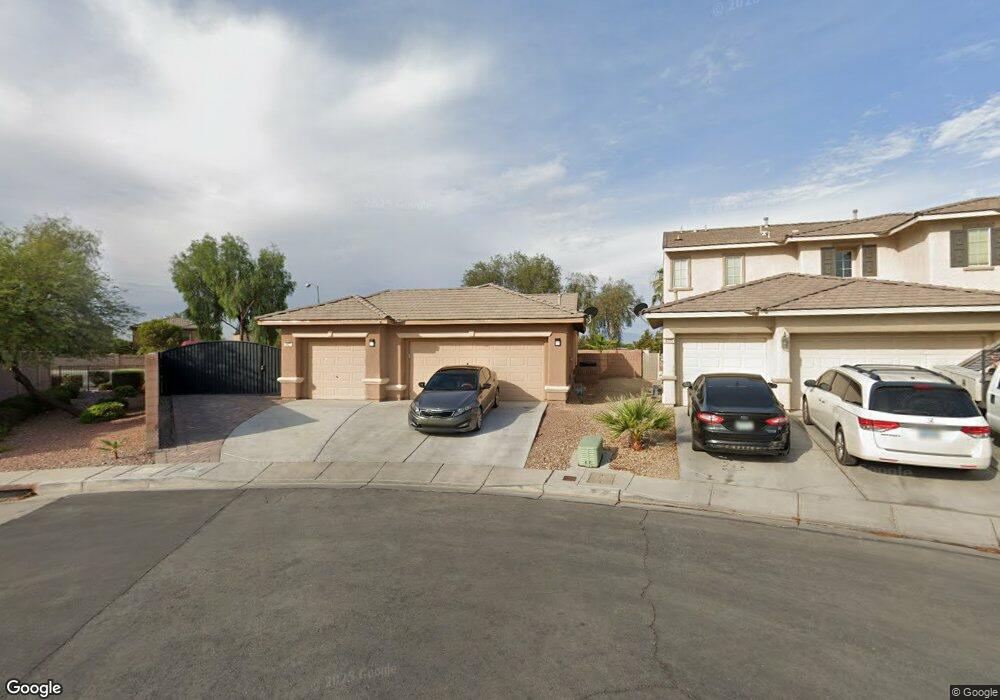
3921 Kristina Lynn Ave North Las Vegas, NV 89081
Northridge NeighborhoodEstimated Value: $410,000 - $487,804
3
Beds
2
Baths
1,765
Sq Ft
$252/Sq Ft
Est. Value
About This Home
This home is located at 3921 Kristina Lynn Ave, North Las Vegas, NV 89081 and is currently estimated at $444,201, approximately $251 per square foot. 3921 Kristina Lynn Ave is a home located in Clark County with nearby schools including D.L. Dusty Dickens Elementary School, Carroll M. Johnston STEM Academy of Environmental Studies, and Clifford O. Findlay Middle School.
Ownership History
Date
Name
Owned For
Owner Type
Purchase Details
Closed on
Jun 10, 2009
Sold by
The Bank Of New York
Bought by
Paramo Moses
Current Estimated Value
Home Financials for this Owner
Home Financials are based on the most recent Mortgage that was taken out on this home.
Original Mortgage
$154,646
Outstanding Balance
$97,655
Interest Rate
4.76%
Mortgage Type
FHA
Estimated Equity
$346,546
Purchase Details
Closed on
Feb 18, 2009
Sold by
Mullin Thomas R
Bought by
The Bank Of New York
Purchase Details
Closed on
Feb 21, 2006
Sold by
Us Home Corp
Bought by
Mullin Thomas R
Home Financials for this Owner
Home Financials are based on the most recent Mortgage that was taken out on this home.
Original Mortgage
$276,500
Interest Rate
6.2%
Mortgage Type
Fannie Mae Freddie Mac
Purchase Details
Closed on
Oct 31, 2005
Sold by
Gmac Model Home Finance Inc
Bought by
Us Home Corp Inc
Purchase Details
Closed on
Jun 10, 2005
Sold by
Gmac Model Home Finance Inc
Bought by
Us Home Corp Nc
Create a Home Valuation Report for This Property
The Home Valuation Report is an in-depth analysis detailing your home's value as well as a comparison with similar homes in the area
Home Values in the Area
Average Home Value in this Area
Purchase History
| Date | Buyer | Sale Price | Title Company |
|---|---|---|---|
| Paramo Moses | $157,500 | First American Title Paseo V | |
| The Bank Of New York | $148,750 | None Available | |
| Mullin Thomas R | $345,640 | North American Title Co | |
| Us Home Corp Inc | $4,094,537 | North American Title Company | |
| Us Home Corp Nc | $1,909,422 | North American Title Co |
Source: Public Records
Mortgage History
| Date | Status | Borrower | Loan Amount |
|---|---|---|---|
| Open | Paramo Moses | $154,646 | |
| Previous Owner | Mullin Thomas R | $276,500 |
Source: Public Records
Tax History Compared to Growth
Tax History
| Year | Tax Paid | Tax Assessment Tax Assessment Total Assessment is a certain percentage of the fair market value that is determined by local assessors to be the total taxable value of land and additions on the property. | Land | Improvement |
|---|---|---|---|---|
| 2025 | $2,193 | $155,330 | $41,965 | $113,365 |
| 2024 | $2,129 | $155,330 | $41,965 | $113,365 |
| 2023 | $2,129 | $147,406 | $41,580 | $105,826 |
| 2022 | $2,067 | $118,172 | $33,880 | $84,292 |
| 2021 | $2,007 | $112,560 | $31,570 | $80,990 |
| 2020 | $1,946 | $104,920 | $28,490 | $76,430 |
| 2019 | $1,889 | $99,303 | $26,950 | $72,353 |
| 2018 | $1,855 | $87,968 | $21,560 | $66,408 |
| 2017 | $2,701 | $80,529 | $19,250 | $61,279 |
| 2016 | $1,737 | $70,811 | $15,400 | $55,411 |
| 2015 | $1,733 | $62,340 | $11,550 | $50,790 |
| 2014 | $1,679 | $48,577 | $9,240 | $39,337 |
Source: Public Records
Map
Nearby Homes
- 5941 Galway Bay St
- 4016 Gaster Ave
- 4017 Kristina Lynn Ave
- 3844 Hollycroft Dr
- 6079 Salsbury Cove Dr
- 3760 E Carisbrook Dr
- 3736 Rocklin Peak Ave
- 3760 Hollycroft Dr
- 5844 Delaney Falls St
- 6009 La Coste St
- 4112 Carol Bailey Ave
- 4104 Free Bird Crest Ave
- 3728 Garnet Heights Ave
- 6021 Vivanco St
- 3709 Citrus Heights Ave
- 3712 Rocklin Peak Ave
- 6052 Puesta Del Sol St
- 3913 Pepper Thorn Ave Unit 201
- 3712 Garnet Heights Ave
- 6247 Fort Worth St Unit 1
- 6005 Watermelon St Unit 1
- 3925 Kristina Lynn Ave
- 6009 Watermelon St
- 6009 Watermelon St Unit n/a
- 3929 Kristina Lynn Ave
- 6013 Watermelon St
- 3926 Kristina Lynn Ave
- 3933 Kristina Lynn Ave
- 3930 Kristina Lynn Ave
- 3908 Carol Bailey Ave
- 3912 Carol Bailey Ave
- 6017 Watermelon St
- 3904 Carol Bailey Ave
- 3937 Kristina Lynn Ave
- 3920 Carol Bailey Ave
- 3924 Carol Bailey Ave
- 6021 Watermelon St
- 3927 Gaster Ave
- 3941 Kristina Lynn Ave
- 3928 Carol Bailey Ave