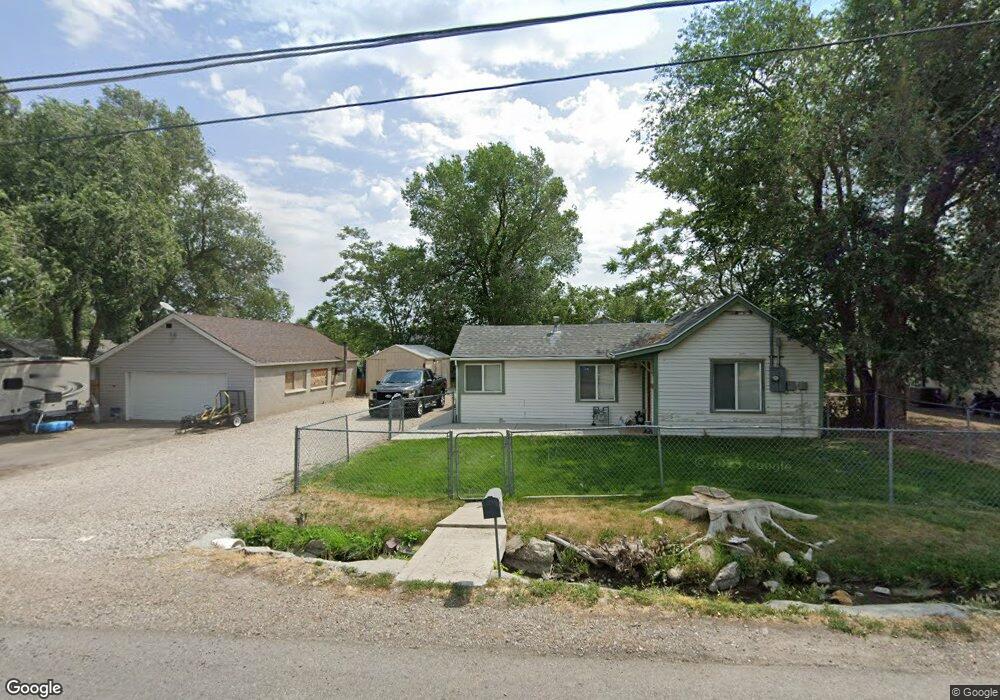
3921 S 6400 W Salt Lake City, UT 84128
Hunter NeighborhoodEstimated Value: $290,000 - $380,000
1
Bed
1
Bath
648
Sq Ft
$510/Sq Ft
Est. Value
About This Home
This home is located at 3921 S 6400 W, Salt Lake City, UT 84128 and is currently estimated at $330,459, approximately $509 per square foot. 3921 S 6400 W is a home located in Salt Lake County with nearby schools including Whittier School, Hunter Jr High School, and Hunter High School.
Ownership History
Date
Name
Owned For
Owner Type
Purchase Details
Closed on
Jan 31, 2022
Sold by
Defa Laney W
Bought by
Ryland Properties Llc
Current Estimated Value
Home Financials for this Owner
Home Financials are based on the most recent Mortgage that was taken out on this home.
Original Mortgage
$85,700
Outstanding Balance
$79,437
Interest Rate
3.56%
Mortgage Type
New Conventional
Estimated Equity
$251,022
Purchase Details
Closed on
Jan 28, 2022
Sold by
Defa Laney W
Bought by
Ryland Properties Llc
Home Financials for this Owner
Home Financials are based on the most recent Mortgage that was taken out on this home.
Original Mortgage
$85,700
Outstanding Balance
$79,437
Interest Rate
3.56%
Mortgage Type
New Conventional
Estimated Equity
$251,022
Purchase Details
Closed on
Jan 26, 2022
Sold by
Ryland Properties Llc
Bought by
Defa Laney W and Defa Ryan J
Home Financials for this Owner
Home Financials are based on the most recent Mortgage that was taken out on this home.
Original Mortgage
$85,700
Outstanding Balance
$79,437
Interest Rate
3.56%
Mortgage Type
New Conventional
Estimated Equity
$251,022
Purchase Details
Closed on
Nov 9, 2021
Sold by
Henderson Laney W
Bought by
Ryland Properties Llc
Purchase Details
Closed on
Mar 15, 2010
Sold by
Defa Richard L
Bought by
Henderson Laney W
Home Financials for this Owner
Home Financials are based on the most recent Mortgage that was taken out on this home.
Original Mortgage
$83,028
Interest Rate
5.25%
Mortgage Type
FHA
Purchase Details
Closed on
Jun 12, 2009
Sold by
Fannie Mae
Bought by
Defa Richard L
Purchase Details
Closed on
Feb 27, 2009
Sold by
Gillespie Cindy and Clay Michael
Bought by
Federal National Mortgage Association
Purchase Details
Closed on
Feb 28, 2007
Sold by
Palmer Ryan L
Bought by
Gillespie Cindy and Clay Michael
Home Financials for this Owner
Home Financials are based on the most recent Mortgage that was taken out on this home.
Original Mortgage
$112,750
Interest Rate
6.29%
Mortgage Type
Purchase Money Mortgage
Purchase Details
Closed on
Oct 15, 1997
Sold by
Miller Kay E Marie Owens
Bought by
Palmer Ryan L
Home Financials for this Owner
Home Financials are based on the most recent Mortgage that was taken out on this home.
Original Mortgage
$70,875
Interest Rate
7.49%
Purchase Details
Closed on
Apr 30, 1997
Sold by
Miller Kaye Marie Owens and Bringhurst Zelma
Bought by
Miller Kaye Marie Owens
Create a Home Valuation Report for This Property
The Home Valuation Report is an in-depth analysis detailing your home's value as well as a comparison with similar homes in the area
Home Values in the Area
Average Home Value in this Area
Purchase History
| Date | Buyer | Sale Price | Title Company |
|---|---|---|---|
| Ryland Properties Llc | -- | -- | |
| Ryland Properties Llc | -- | -- | |
| Ryland Properties Llc | -- | -- | |
| Ryland Properties Llc | -- | -- | |
| Defa Laney W | -- | Silver Leaf Title Insurance Ag | |
| Defa Laney W | -- | Silver Leaf Title Insurance Ag | |
| Defa Laney W | -- | Silver Leaf Title Insurance Ag | |
| Ryland Properties Llc | -- | Real Advantage Ttl Ins Agcy | |
| Henderson Laney W | -- | 1St Natl Title Ins Agency | |
| Defa Richard L | $45,000 | None Available | |
| Federal National Mortgage Association | $102,894 | Backman Title Services | |
| Gillespie Cindy | -- | First American Title | |
| Palmer Ryan L | -- | -- | |
| Miller Kaye Marie Owens | -- | -- |
Source: Public Records
Mortgage History
| Date | Status | Borrower | Loan Amount |
|---|---|---|---|
| Open | Ryland Properties Llc | $85,700 | |
| Closed | Ryland Properties Llc | $85,700 | |
| Closed | Ryland Properties Llc | $85,700 | |
| Closed | Defa Laney W | $85,700 | |
| Previous Owner | Henderson Laney W | $83,028 | |
| Previous Owner | Gillespie Cindy | $112,750 | |
| Previous Owner | Palmer Ryan L | $70,875 |
Source: Public Records
Tax History Compared to Growth
Tax History
| Year | Tax Paid | Tax Assessment Tax Assessment Total Assessment is a certain percentage of the fair market value that is determined by local assessors to be the total taxable value of land and additions on the property. | Land | Improvement |
|---|---|---|---|---|
| 2025 | $1,486 | $280,000 | $122,100 | $157,900 |
| 2024 | $1,486 | $226,900 | $113,100 | $113,800 |
| 2023 | $1,486 | $220,800 | $108,800 | $112,000 |
| 2022 | $1,541 | $225,800 | $106,600 | $119,200 |
| 2021 | $1,386 | $182,500 | $82,000 | $100,500 |
| 2020 | $1,332 | $165,500 | $77,700 | $87,800 |
| 2019 | $1,310 | $157,000 | $64,000 | $93,000 |
| 2018 | $1,299 | $150,400 | $64,000 | $86,400 |
| 2017 | $1,157 | $136,200 | $64,000 | $72,200 |
| 2016 | $1,007 | $118,800 | $64,000 | $54,800 |
| 2015 | $960 | $107,800 | $60,200 | $47,600 |
| 2014 | $905 | $99,600 | $64,800 | $34,800 |
Source: Public Records
Map
Nearby Homes
- 3896 S 6325 W
- 3833 S 6325 W
- 6527 W 3940 S
- 6525 W 3850 S
- 6497 W King Valley Rd
- 6489 W Castle View Dr
- 3794 Chatterleigh Rd
- 6585 W 3785 S
- 6614 King Valley Rd
- 6487 W Newton Farm Dr
- 6718 W Halter Creek Way
- 6104 W Patti Dr
- 6770 W 3860 S
- 4205 S Zeus Dr
- 4031 S 6820 W
- 6357 W 3570 S
- 4197 S 6115 W
- 3960 S 6865 W
- 3555 S 6470 W
- 3540 S 6400 W