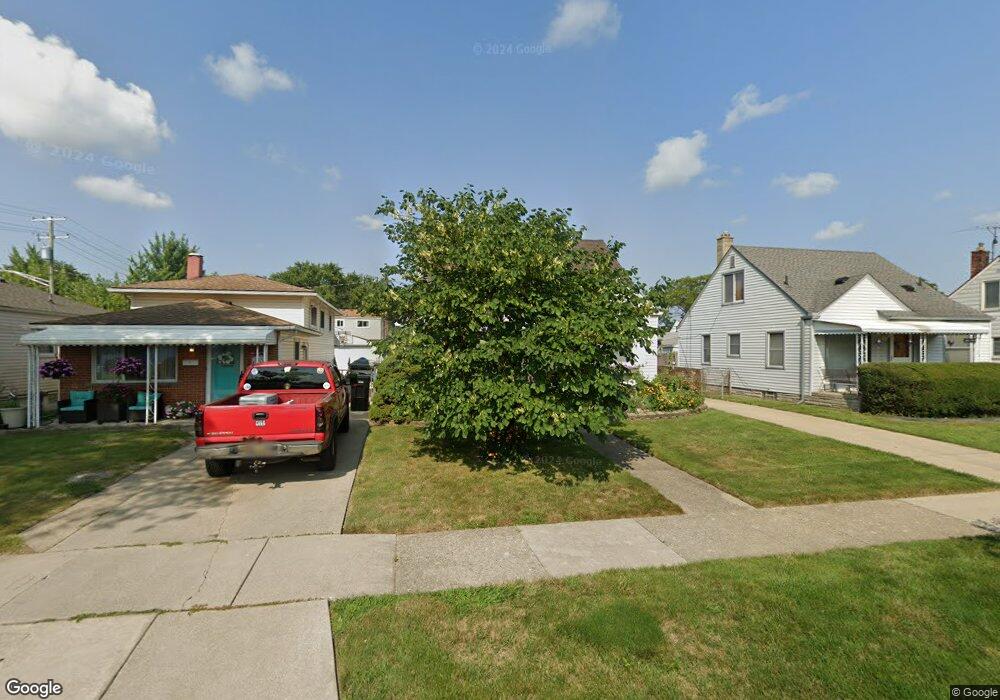
3922 14th St Wyandotte, MI 48192
Estimated Value: $162,000 - $169,032
3
Beds
1
Bath
1,022
Sq Ft
$162/Sq Ft
Est. Value
About This Home
This home is located at 3922 14th St, Wyandotte, MI 48192 and is currently estimated at $165,758, approximately $162 per square foot. 3922 14th St is a home located in Wayne County with nearby schools including Monroe Elementary School, Woodrow Wilson School, and Roosevelt High School.
Ownership History
Date
Name
Owned For
Owner Type
Purchase Details
Closed on
Sep 7, 2011
Sold by
Secretary Of Housing & Urban Development
Bought by
Cianfarani Susan
Current Estimated Value
Purchase Details
Closed on
Oct 28, 2010
Sold by
Chase Home Finance Llc
Bought by
Secretary Of Housing & Urban Development
Purchase Details
Closed on
Jul 22, 2010
Sold by
Banks Patrick R and Chambers Sarah L
Bought by
Chase Home Finance Llc
Purchase Details
Closed on
Feb 26, 2003
Sold by
Hackenberg Richard M and Hackenberg Diane K
Bought by
Banks Patrick R
Create a Home Valuation Report for This Property
The Home Valuation Report is an in-depth analysis detailing your home's value as well as a comparison with similar homes in the area
Home Values in the Area
Average Home Value in this Area
Purchase History
| Date | Buyer | Sale Price | Title Company |
|---|---|---|---|
| Cianfarani Susan | $31,000 | None Available | |
| Secretary Of Housing & Urban Development | -- | None Available | |
| Chase Home Finance Llc | $125,164 | None Available | |
| Banks Patrick R | $118,900 | Michigan Title Insurance Age |
Source: Public Records
Tax History Compared to Growth
Tax History
| Year | Tax Paid | Tax Assessment Tax Assessment Total Assessment is a certain percentage of the fair market value that is determined by local assessors to be the total taxable value of land and additions on the property. | Land | Improvement |
|---|---|---|---|---|
| 2025 | $1,758 | $68,500 | $0 | $0 |
| 2024 | $1,758 | $61,200 | $0 | $0 |
| 2023 | $1,677 | $56,700 | $0 | $0 |
| 2022 | $1,942 | $46,900 | $0 | $0 |
| 2021 | $1,904 | $45,200 | $0 | $0 |
| 2020 | $1,877 | $42,900 | $0 | $0 |
| 2019 | $1,851 | $39,600 | $0 | $0 |
| 2018 | $1,478 | $40,000 | $0 | $0 |
| 2017 | $647 | $40,000 | $0 | $0 |
| 2016 | $1,788 | $36,400 | $0 | $0 |
| 2015 | $3,190 | $33,800 | $0 | $0 |
| 2013 | $3,090 | $30,900 | $0 | $0 |
| 2012 | $1,814 | $32,400 | $8,400 | $24,000 |
Source: Public Records
Map
Nearby Homes