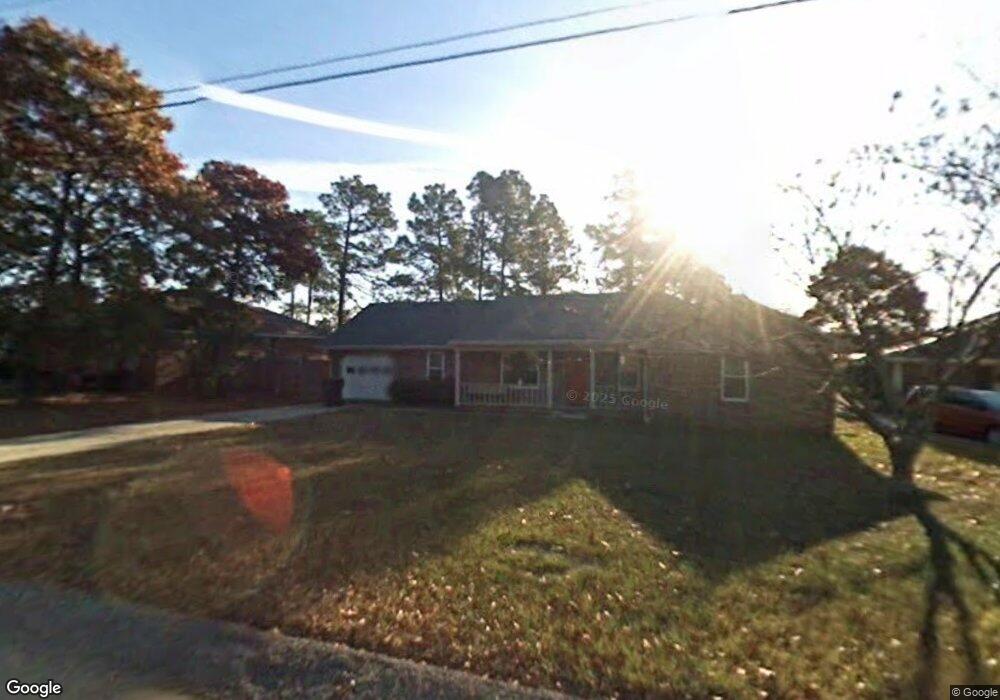
3922 Bowen Dr Hephzibah, GA 30815
Jamestown NeighborhoodEstimated Value: $214,287 - $260,000
4
Beds
2
Baths
1,868
Sq Ft
$127/Sq Ft
Est. Value
About This Home
This home is located at 3922 Bowen Dr, Hephzibah, GA 30815 and is currently estimated at $237,822, approximately $127 per square foot. 3922 Bowen Dr is a home located in Richmond County with nearby schools including Deer Chase Elementary School, Hephzibah Middle School, and Johnson Magnet.
Ownership History
Date
Name
Owned For
Owner Type
Purchase Details
Closed on
Oct 28, 1993
Sold by
Housing & Urban Development Secretary Of
Bought by
Lewis Frances G
Current Estimated Value
Purchase Details
Closed on
Sep 30, 1993
Sold by
Housing & Urban Dev
Bought by
Lewis Frances G
Purchase Details
Closed on
May 17, 1993
Sold by
First Union Mortgage Corp
Bought by
Housing & Urban Development Secretary Of
Purchase Details
Closed on
Apr 20, 1993
Sold by
Chatman Bruce By Atty Chatman Vernita R
Bought by
First Union Mortgage Corp
Purchase Details
Closed on
Apr 6, 1993
Sold by
First Union Mortgag
Bought by
Housing & Urban Dev
Purchase Details
Closed on
Sep 4, 1990
Sold by
Chatman Bruce
Bought by
Mccorkle Walter M J
Purchase Details
Closed on
Jul 10, 1989
Sold by
Leonard Quick Builders Inc
Bought by
Chatman Bruce Chatman Vernita R
Purchase Details
Closed on
Jul 1, 1989
Sold by
Leonard Quick Build
Bought by
Chatman Bruce
Purchase Details
Closed on
Aug 1, 1988
Sold by
.Jefferson Contracto
Bought by
Leonard Quick Build
Purchase Details
Closed on
Mar 1, 1988
Sold by
Nuite Ella Clarke
Bought by
.Jefferson Contracto
Create a Home Valuation Report for This Property
The Home Valuation Report is an in-depth analysis detailing your home's value as well as a comparison with similar homes in the area
Home Values in the Area
Average Home Value in this Area
Purchase History
| Date | Buyer | Sale Price | Title Company |
|---|---|---|---|
| Lewis Frances G | -- | -- | |
| Lewis Frances G | $78,200 | -- | |
| Housing & Urban Development Secretary Of | -- | -- | |
| First Union Mortgage Corp | -- | -- | |
| Housing & Urban Dev | $82,500 | -- | |
| First Union Mortgag | $82,500 | -- | |
| Mccorkle Walter M J | $81,400 | -- | |
| Chatman Bruce Chatman Vernita R | $74,900 | -- | |
| Chatman Bruce | $74,900 | -- | |
| Leonard Quick Build | $21,000 | -- | |
| .Jefferson Contracto | $25,700 | -- |
Source: Public Records
Tax History
| Year | Tax Paid | Tax Assessment Tax Assessment Total Assessment is a certain percentage of the fair market value that is determined by local assessors to be the total taxable value of land and additions on the property. | Land | Improvement |
|---|---|---|---|---|
| 2025 | $2,361 | $83,372 | $7,200 | $76,172 |
| 2024 | $2,361 | $81,916 | $7,200 | $74,716 |
| 2023 | $1,512 | $75,216 | $7,200 | $68,016 |
| 2022 | $1,539 | $53,609 | $7,200 | $46,409 |
| 2021 | $1,308 | $42,208 | $7,200 | $35,008 |
| 2020 | $1,289 | $42,208 | $7,200 | $35,008 |
| 2019 | $1,358 | $42,208 | $7,200 | $35,008 |
| 2018 | $1,609 | $42,208 | $7,200 | $35,008 |
| 2017 | $1,706 | $42,208 | $7,200 | $35,008 |
| 2016 | $1,570 | $42,208 | $7,200 | $35,008 |
| 2015 | $1,580 | $42,208 | $7,200 | $35,008 |
| 2014 | $1,571 | $41,875 | $7,200 | $34,675 |
Source: Public Records
Map
Nearby Homes
- 3936 Ellen St
- 3716 Pinnacle Place Dr
- 3904 Ellen St
- 3823 Woodlake Dr
- 3714 Carrington Ct
- 3420 Firestone Dr Unit 157
- 3436 Firestone Dr
- 3438 Firestone Dr
- 3462 Firestone Dr
- 3466 Firestone Dr
- 2604 Carrington Dr
- 3421 Firestone Dr Unit 87
- 3419 Firestone Dr Unit 86
- 3417 Firestone Dr Unit 85
- 3492 Firestone Dr
- 3748 Pinnacle Place Dr
- 5432 Thrasher Ln
- 4060 Pinnacle Way
- 2636 Carrington Dr
- 3538 Firestone Dr
Your Personal Tour Guide
Ask me questions while you tour the home.