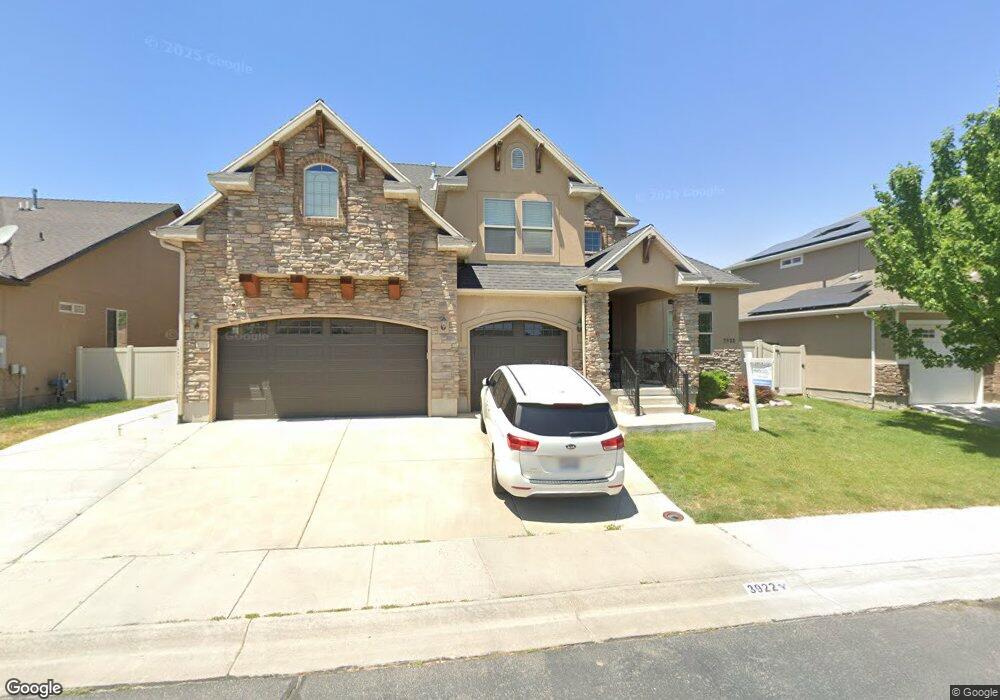
3922 Nipoma Dune Dr South Jordan, UT 84095
Oquirrh Park NeighborhoodEstimated Value: $817,000 - $948,000
4
Beds
4
Baths
4,708
Sq Ft
$184/Sq Ft
Est. Value
About This Home
This home is located at 3922 Nipoma Dune Dr, South Jordan, UT 84095 and is currently estimated at $867,100, approximately $184 per square foot. 3922 Nipoma Dune Dr is a home located in Salt Lake County with nearby schools including Eastlake Elementary School, Elk Ridge Middle School, and Mountain West Montessori Academy.
Ownership History
Date
Name
Owned For
Owner Type
Purchase Details
Closed on
Jan 29, 2025
Sold by
Bybee Ariel C
Bought by
Bybee Ariel C and Morillo Danilo
Current Estimated Value
Purchase Details
Closed on
Apr 14, 2021
Sold by
Bybee Karin M
Bought by
Bybee Ariel C and Bybee Karin M
Purchase Details
Closed on
Apr 12, 2021
Sold by
Morillo Danilo A and Bybee Ariel C
Bought by
Bybee Karin M
Purchase Details
Closed on
Jul 10, 2013
Sold by
Bybee Richard and Bybee Karin M
Bought by
Bybee Richard C B and Bybee Karin M
Purchase Details
Closed on
Mar 5, 2009
Sold by
Putnam Gregory
Bought by
Putnam Gregory and Putnam Lisa
Home Financials for this Owner
Home Financials are based on the most recent Mortgage that was taken out on this home.
Original Mortgage
$313,040
Interest Rate
5.08%
Mortgage Type
Seller Take Back
Purchase Details
Closed on
Mar 4, 2009
Sold by
M & T Bank
Bought by
Putnam Gregory
Home Financials for this Owner
Home Financials are based on the most recent Mortgage that was taken out on this home.
Original Mortgage
$313,040
Interest Rate
5.08%
Mortgage Type
Seller Take Back
Purchase Details
Closed on
Apr 22, 2008
Sold by
Doug Jessop Construction Inc
Bought by
M&T Bank
Purchase Details
Closed on
Feb 21, 2007
Sold by
Wasatch Homes At Sand Dunes Llc
Bought by
Doug Jessop Construction Inc
Home Financials for this Owner
Home Financials are based on the most recent Mortgage that was taken out on this home.
Original Mortgage
$420,000
Interest Rate
6.21%
Mortgage Type
Construction
Purchase Details
Closed on
Jan 12, 2007
Sold by
J & K Investment Properties Llc
Bought by
Wasatch Homes At Sand Dunes Llc
Home Financials for this Owner
Home Financials are based on the most recent Mortgage that was taken out on this home.
Original Mortgage
$420,000
Interest Rate
6.21%
Mortgage Type
Construction
Create a Home Valuation Report for This Property
The Home Valuation Report is an in-depth analysis detailing your home's value as well as a comparison with similar homes in the area
Home Values in the Area
Average Home Value in this Area
Purchase History
| Date | Buyer | Sale Price | Title Company |
|---|---|---|---|
| Bybee Ariel C | -- | Richland Title Insurance Agenc | |
| Bybee Ariel C | -- | Richland Title Ins Agcy Inc | |
| Bybee Karin M | -- | Richland Title Ins Agcy Inc | |
| Bybee Karin M | -- | Richland Title Ins Agcy Inc | |
| Bybee Richard C B | -- | Accommodation | |
| Putnam Gregory | -- | Metro National Title | |
| Putnam Gregory | -- | Metro National Title | |
| M&T Bank | -- | None Available | |
| Doug Jessop Construction Inc | -- | Metro National Title | |
| Wasatch Homes At Sand Dunes Llc | -- | Integrated Title Ins Svcs |
Source: Public Records
Mortgage History
| Date | Status | Borrower | Loan Amount |
|---|---|---|---|
| Previous Owner | Putnam Gregory | $313,040 | |
| Previous Owner | Doug Jessop Construction Inc | $420,000 | |
| Previous Owner | Wasatch Homes At Sand Dunes Llc | $764,341 | |
| Previous Owner | Wasatch Homes At Sand Dunes Llc | $1,497,300 |
Source: Public Records
Tax History Compared to Growth
Tax History
| Year | Tax Paid | Tax Assessment Tax Assessment Total Assessment is a certain percentage of the fair market value that is determined by local assessors to be the total taxable value of land and additions on the property. | Land | Improvement |
|---|---|---|---|---|
| 2025 | $4,099 | $842,600 | $170,100 | $672,500 |
| 2024 | $4,099 | $778,200 | $157,900 | $620,300 |
| 2023 | $4,099 | $749,600 | $153,300 | $596,300 |
| 2022 | $4,373 | $767,800 | $150,300 | $617,500 |
| 2021 | $3,623 | $583,600 | $114,800 | $468,800 |
| 2020 | $3,571 | $539,300 | $111,100 | $428,200 |
| 2019 | $3,521 | $522,700 | $111,100 | $411,600 |
| 2018 | $3,322 | $490,700 | $111,100 | $379,600 |
| 2017 | $3,226 | $467,000 | $86,700 | $380,300 |
| 2016 | $3,387 | $464,600 | $86,700 | $377,900 |
| 2015 | $3,333 | $444,500 | $88,300 | $356,200 |
| 2014 | $3,187 | $417,700 | $84,200 | $333,500 |
Source: Public Records
Map
Nearby Homes
- 10918 Little Sahara Dr Unit 1001
- 3884 Coral Dune Dr Unit 222
- 10934 Little Sahara Dr
- 3884 Sand Lake Dr
- 10941 Little Sahara Dr
- 10896 S Poplar Brook Place
- 3907 W Tottori Dune Dr
- 10931 S Glamis Dune Dr
- Princeton Plan at High Pointe
- Sheridan Plan at High Pointe
- Dashell Plan at High Pointe
- Dakota Plan at High Pointe
- Olympus Plan at High Pointe
- Sweetwater Plan at High Pointe
- Roosevelt Plan at High Pointe
- Witzel Plan at High Pointe
- 11789 4000 W
- 10674 S Pine Shadow Rd
- 10674 Pine Shadow Rd
- 3878 W Sage Willow Dr
- 3922 W Nipoma Dune Dr
- 3912 W Nipoma Dune Dr
- 3912 W Nipoma Dune Dr Unit 419
- 3912 Nipoma Dune Dr
- 3934 Nipoma Dune Dr
- 3934 W Nipoma Dune Dr
- 10902 Dune Grass Dr
- 3902 Nipoma Dune Dr
- 3927 W Nipoma Dune Dr
- 3902 W Nipoma Dune Dr Unit 420
- 3902 W Nipoma Dune Dr
- 10913 Eureka Dune Dr
- 10913 S Eureka Dune Dr
- 3907 Nipoma Dune Dr
- 3907 Nipoma Dune Dr Unit 433
- 3907 W Nipoma Dune Dr
- 3952 W Oregon Dune Ct
- 3952 Oregon Dune Ct
- 3951 W Coral Dune Dr
- 3894 W Nipoma Dune Dr