Estimated Value: $306,986 - $367,000
3
Beds
2
Baths
1,624
Sq Ft
$207/Sq Ft
Est. Value
About This Home
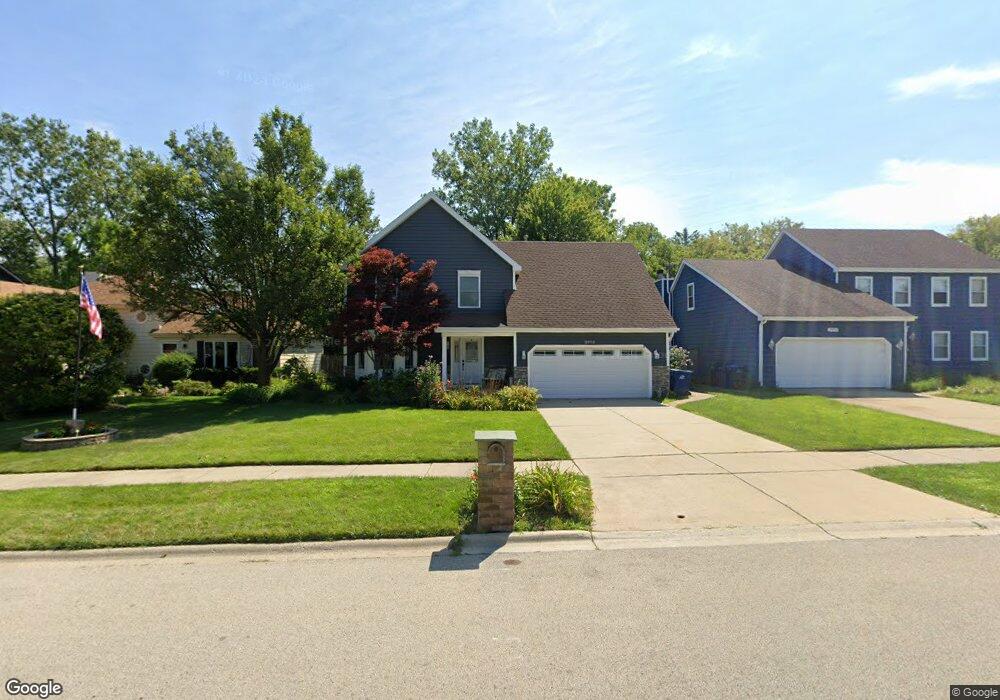
This home is located at 3923 Bertrand Ln, Zion, IL 60099 and is currently estimated at $335,497, approximately $206 per square foot. 3923 Bertrand Ln is a home located in Lake County with nearby schools including Howe Elementary School, Beach Park Middle School, and Zion-Benton Township High School.
Ownership History
Date
Name
Owned For
Owner Type
Purchase Details
Closed on
Jul 3, 2003
Sold by
Cardenas Marco and Cardenas Dora
Bought by
Candelaria Paulette A
Current Estimated Value
Home Financials for this Owner
Home Financials are based on the most recent Mortgage that was taken out on this home.
Original Mortgage
$200,970
Outstanding Balance
$86,150
Interest Rate
5.37%
Mortgage Type
FHA
Estimated Equity
$249,347
Purchase Details
Closed on
Nov 10, 1995
Sold by
Larson Alvar
Bought by
Cardenas Marco and Cardenas Dora
Home Financials for this Owner
Home Financials are based on the most recent Mortgage that was taken out on this home.
Original Mortgage
$125,000
Interest Rate
7.56%
Create a Home Valuation Report for This Property
The Home Valuation Report is an in-depth analysis detailing your home's value as well as a comparison with similar homes in the area
Home Values in the Area
Average Home Value in this Area
Purchase History
| Date | Buyer | Sale Price | Title Company |
|---|---|---|---|
| Candelaria Paulette A | $204,000 | First American Title | |
| Cardenas Marco | $139,000 | Intercounty Title |
Source: Public Records
Mortgage History
| Date | Status | Borrower | Loan Amount |
|---|---|---|---|
| Open | Candelaria Paulette A | $200,970 | |
| Previous Owner | Cardenas Marco | $125,000 |
Source: Public Records
Tax History Compared to Growth
Tax History
| Year | Tax Paid | Tax Assessment Tax Assessment Total Assessment is a certain percentage of the fair market value that is determined by local assessors to be the total taxable value of land and additions on the property. | Land | Improvement |
|---|---|---|---|---|
| 2024 | $7,364 | $76,120 | $5,703 | $70,417 |
| 2023 | $7,403 | $66,735 | $5,505 | $61,230 |
| 2022 | $7,403 | $63,830 | $5,378 | $58,452 |
| 2021 | $7,634 | $62,206 | $5,241 | $56,965 |
| 2020 | $7,491 | $59,362 | $5,001 | $54,361 |
| 2019 | $7,471 | $56,321 | $4,745 | $51,576 |
| 2018 | $7,003 | $51,699 | $5,656 | $46,043 |
| 2017 | $6,917 | $48,635 | $5,321 | $43,314 |
| 2016 | $6,746 | $46,302 | $5,066 | $41,236 |
| 2015 | $6,525 | $42,463 | $4,646 | $37,817 |
| 2014 | $7,552 | $50,178 | $12,480 | $37,698 |
| 2012 | $7,588 | $52,144 | $12,969 | $39,175 |
Source: Public Records
Map
Nearby Homes
- 3931 Bertrand Ln
- 1121 Otto Graham Ln
- 38571 N Cedar Ave
- 10765 W Liberty Ave
- 11345 W Carnahan Ave
- 11382 W Leland Ave
- 1667 W Beach Rd Unit 1667
- 1677 W Beach Rd Unit 1677
- 38683 N Lewis Ave
- 38362 N Manor Ave
- 38176 N De Woody Rd
- 10295 W Crissy Ave
- 1730 W Beach Rd
- 11342-11346 W Wadsworth Rd
- 10209 W Crissy Ave
- 38402 N Russell Ave
- 10381 Country Ln
- 10156 W Beach Rd
- 39161 N Holdridge Ave
- 37905 N Loyola Ave
- 3919 Bertrand Ln
- 3927 Bertrand Ln
- 3915 Bertrand Ln
- 1112 Pine St Unit TEN
- 3913 Bertrand Ln
- 10865 W Chaney Ave
- 1111 Ten Pin Ln
- 1111 Pine St Unit TEN
- 1116 Pine St Unit TEN
- 10844 W Chaney Ave
- 3909 Bertrand Ln
- 10863 W Chaplin Ave
- 1115 Pine St Unit TEN
- 1115 10 Pin Ln
- 1120 Pine St Unit TEN
- 3905 Bertrand Ln
- 1119 10 Pin Ln
- 1119 Ten Pin Ln
- 1110 Bob Ofarrell Ln
- 1124 Pine St Unit TEN