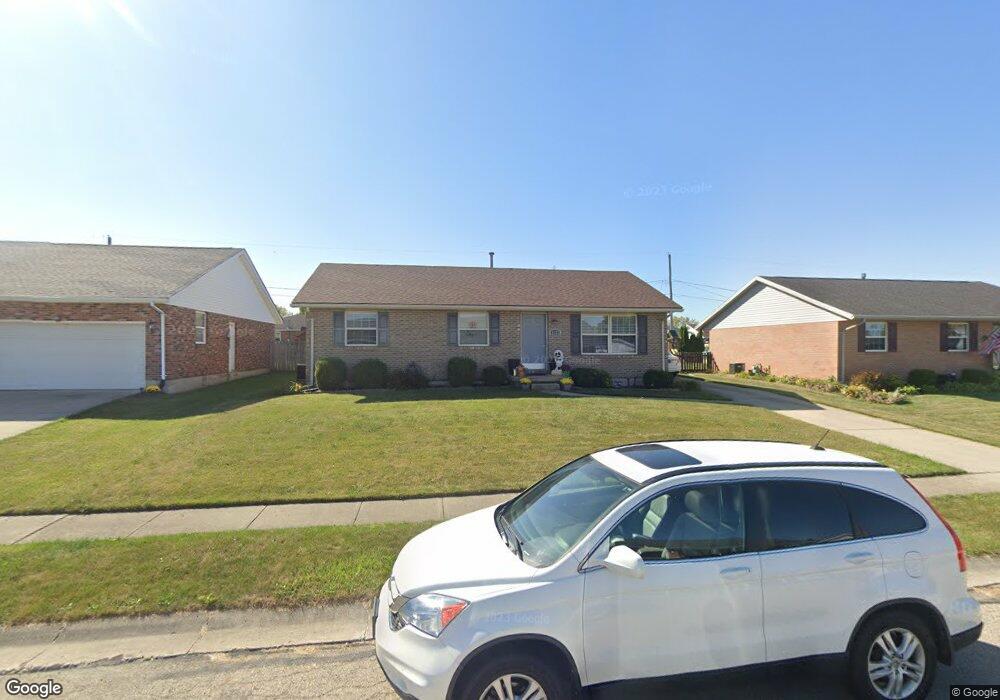
3923 Delmar Cir Springfield, OH 45503
Estimated Value: $224,535 - $242,000
3
Beds
3
Baths
1,176
Sq Ft
$200/Sq Ft
Est. Value
About This Home
This home is located at 3923 Delmar Cir, Springfield, OH 45503 and is currently estimated at $235,384, approximately $200 per square foot. 3923 Delmar Cir is a home located in Clark County with nearby schools including Rolling Hills Elementary School, Northridge Elementary School, and Northridge Middle School.
Ownership History
Date
Name
Owned For
Owner Type
Purchase Details
Closed on
May 11, 2011
Sold by
Miller Daniel P and Miller Lindsey M
Bought by
Ridder Tiffany M
Current Estimated Value
Home Financials for this Owner
Home Financials are based on the most recent Mortgage that was taken out on this home.
Original Mortgage
$116,569
Outstanding Balance
$81,010
Interest Rate
4.88%
Mortgage Type
New Conventional
Estimated Equity
$154,374
Purchase Details
Closed on
Dec 23, 2002
Sold by
Murphy Nancy B and Murphy Nancy A
Bought by
Miller Daniel P
Home Financials for this Owner
Home Financials are based on the most recent Mortgage that was taken out on this home.
Original Mortgage
$104,176
Interest Rate
6.01%
Mortgage Type
FHA
Purchase Details
Closed on
Aug 1, 1994
Sold by
Hoppes Dev Co
Bought by
Murphy Nancy B
Home Financials for this Owner
Home Financials are based on the most recent Mortgage that was taken out on this home.
Original Mortgage
$75,150
Interest Rate
8.41%
Mortgage Type
New Conventional
Create a Home Valuation Report for This Property
The Home Valuation Report is an in-depth analysis detailing your home's value as well as a comparison with similar homes in the area
Home Values in the Area
Average Home Value in this Area
Purchase History
| Date | Buyer | Sale Price | Title Company |
|---|---|---|---|
| Ridder Tiffany M | $115,000 | Attorney | |
| Miller Daniel P | $105,000 | -- | |
| Murphy Nancy B | $79,140 | -- |
Source: Public Records
Mortgage History
| Date | Status | Borrower | Loan Amount |
|---|---|---|---|
| Open | Ridder Tiffany M | $116,569 | |
| Previous Owner | Miller Daniel P | $104,176 | |
| Previous Owner | Murphy Nancy B | $75,150 |
Source: Public Records
Tax History Compared to Growth
Tax History
| Year | Tax Paid | Tax Assessment Tax Assessment Total Assessment is a certain percentage of the fair market value that is determined by local assessors to be the total taxable value of land and additions on the property. | Land | Improvement |
|---|---|---|---|---|
| 2024 | $2,144 | $50,690 | $10,710 | $39,980 |
| 2023 | $2,144 | $50,690 | $10,710 | $39,980 |
| 2022 | $2,152 | $50,690 | $10,710 | $39,980 |
| 2021 | $2,166 | $43,250 | $8,310 | $34,940 |
| 2020 | $2,168 | $43,250 | $8,310 | $34,940 |
| 2019 | $2,209 | $43,250 | $8,310 | $34,940 |
| 2018 | $2,335 | $43,780 | $7,620 | $36,160 |
| 2017 | $2,002 | $39,295 | $7,616 | $31,679 |
| 2016 | $1,988 | $39,295 | $7,616 | $31,679 |
| 2015 | $1,903 | $39,075 | $7,396 | $31,679 |
| 2014 | $1,903 | $39,075 | $7,396 | $31,679 |
| 2013 | $1,859 | $39,075 | $7,396 | $31,679 |
Source: Public Records
Map
Nearby Homes
- 4050 Tacoma St
- 1640 Montego Dr
- 4249 Reno Rd
- 1781 Pinehurst Dr
- 4321 Tulane Rd
- 4438 Tacoma St
- 1503 Kingsgate Rd
- 1505 Kingsgate Rd
- 1509 Kingsgate Rd
- 1501 Kingsgate Rd
- 1507 Kingsgate Rd
- 3631 Kingsgate Ln
- 3500 Oakmont Ct
- 3963 Covington Dr Unit 3963
- 1835 Sierra Ave
- 1139 Greenoak Ct
- 4512 Ridgewood Rd E
- 4524 Ridgewood Rd E
- 3917 Delmar Cir
- 3927 Delmar Cir
- 3930 Tacoma St
- 3913 Delmar Cir
- 3936 Tacoma St
- 3924 Tacoma St
- 3931 Delmar Cir
- 3928 Delmar Cir
- 3920 Delmar Cir
- 3942 Tacoma St
- 3920 Tacoma St
- 3909 Delmar Cir
- 3916 Delmar Cir
- 3937 Delmar Cir
- 3948 Tacoma St
- 3912 Tacoma St
- 3910 Delmar Cir
- 3963 Delmar Cir
- 1637 Delmar Dr
- 3941 Delmar Cir