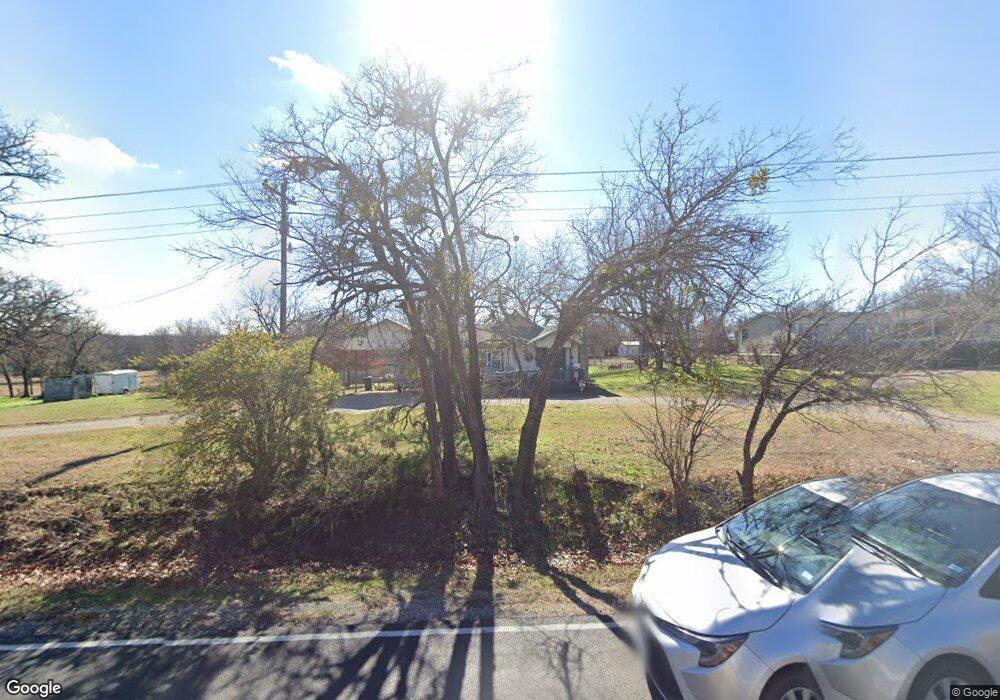
3923 Greenwood Rd Weatherford, TX 76088
Estimated Value: $359,015 - $436,000
3
Beds
3
Baths
1,639
Sq Ft
$244/Sq Ft
Est. Value
About This Home
This home is located at 3923 Greenwood Rd, Weatherford, TX 76088 and is currently estimated at $399,754, approximately $243 per square foot. 3923 Greenwood Rd is a home located in Parker County with nearby schools including Wright Elementary School, Hall Middle School, and Weatherford High School.
Ownership History
Date
Name
Owned For
Owner Type
Purchase Details
Closed on
Aug 18, 2017
Sold by
Hutton Dena Kay
Bought by
Graham Newell and Graham Rebecca
Current Estimated Value
Home Financials for this Owner
Home Financials are based on the most recent Mortgage that was taken out on this home.
Original Mortgage
$146,775
Interest Rate
3.96%
Mortgage Type
Purchase Money Mortgage
Purchase Details
Closed on
Apr 20, 2012
Sold by
Graham Newell and Graham Rebecca
Bought by
Hutton Dena K
Home Financials for this Owner
Home Financials are based on the most recent Mortgage that was taken out on this home.
Original Mortgage
$102,000
Interest Rate
3.92%
Mortgage Type
USDA
Purchase Details
Closed on
Aug 27, 2001
Sold by
Garrett Gladys F
Bought by
Hutton Dena K
Purchase Details
Closed on
Apr 12, 1990
Bought by
Hutton Dena K
Create a Home Valuation Report for This Property
The Home Valuation Report is an in-depth analysis detailing your home's value as well as a comparison with similar homes in the area
Home Values in the Area
Average Home Value in this Area
Purchase History
| Date | Buyer | Sale Price | Title Company |
|---|---|---|---|
| Graham Newell | -- | None Available | |
| Hutton Dena K | -- | Reunion Title | |
| Hutton Dena K | -- | -- | |
| Hutton Dena K | -- | -- |
Source: Public Records
Mortgage History
| Date | Status | Borrower | Loan Amount |
|---|---|---|---|
| Closed | Graham Newell | $146,775 | |
| Previous Owner | Hutton Dena K | $102,000 |
Source: Public Records
Tax History Compared to Growth
Tax History
| Year | Tax Paid | Tax Assessment Tax Assessment Total Assessment is a certain percentage of the fair market value that is determined by local assessors to be the total taxable value of land and additions on the property. | Land | Improvement |
|---|---|---|---|---|
| 2025 | $1,011 | $239,592 | -- | -- |
| 2024 | $1,011 | $217,811 | -- | -- |
| 2023 | $1,011 | $198,010 | $0 | $0 |
| 2022 | $3,416 | $180,010 | $56,540 | $123,470 |
| 2021 | $3,451 | $180,010 | $56,540 | $123,470 |
| 2020 | $3,244 | $150,790 | $37,190 | $113,600 |
| 2019 | $3,233 | $150,790 | $37,190 | $113,600 |
| 2018 | $2,972 | $127,380 | $20,170 | $107,210 |
| 2017 | $2,719 | $126,880 | $20,170 | $106,710 |
| 2016 | $2,472 | $102,320 | $17,860 | $84,460 |
| 2015 | $2,023 | $102,320 | $17,860 | $84,460 |
| 2014 | $2,083 | $87,000 | $20,560 | $66,440 |
Source: Public Records
Map
Nearby Homes
- 209 Grace Ct
- 4204 Greenwood Rd
- 134 Forest Creek Cir
- 2056 Vaquero Dr
- 119 Forest Creek Cir
- 3703 Greenwood Rd
- 4009 Estancia Ct
- 2066 Ellis Dr
- 1027 Estancia Blvd
- 1035 Estancia Blvd
- 100 Overton Ridge Cir
- 142 Wood Oak Trail
- 177 Pack Saddle Trail
- 105 Michael Ln
- 169 Pack Saddle Trail
- 119 Michael Ln
- 103 Saddle Club Rd
- 330 Pack Saddle Ct
- 305 Wrangler Ct
- 313 Wrangler Ct
- 3929 Greenwood Rd
- 3917 Greenwood Rd
- 3935 Greenwood Rd
- 3945 Greenwood Rd
- 3951 Greenwood Rd
- 3913 Greenwood Rd
- 3832 Greenwood Rd
- 3963 Greenwood Rd
- 3970 Greenwood Rd
- 3816 Greenwood Rd
- 140 Grace View Rd
- 3820 Greenwood Rd
- 367 Saddle Club Rd
- 196 Brook Hollow Ln
- 195 Brook Hollow Ln
- 3950 Greenwood Rd
- 4033 Greenwood Rd
- 4033 Greenwood Rd
- 4000 Greenwood Rd
- 190 Brook Hollow Ln