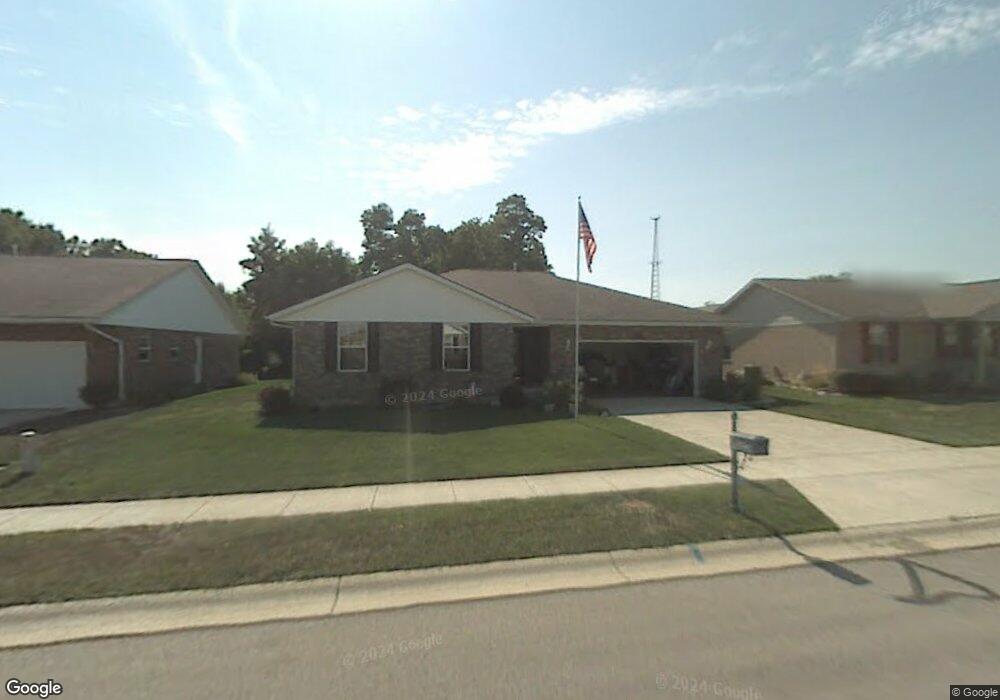
3923 Harris Ln Springfield, OH 45503
Estimated Value: $270,000 - $297,000
3
Beds
2
Baths
1,466
Sq Ft
$192/Sq Ft
Est. Value
About This Home
This home is located at 3923 Harris Ln, Springfield, OH 45503 and is currently estimated at $280,980, approximately $191 per square foot. 3923 Harris Ln is a home located in Clark County with nearby schools including Northridge Elementary School, Kenton Ridge Middle & High School, and Emmanuel Christian Academy.
Ownership History
Date
Name
Owned For
Owner Type
Purchase Details
Closed on
Dec 31, 2010
Sold by
Hoppes Builders & Development Co
Bought by
Fink Lloyd Thomas and Fink Winona
Current Estimated Value
Purchase Details
Closed on
Jun 21, 2002
Sold by
Hoppes Builders & Development Co
Bought by
Fink Lloyd Thomas and Fink Winona
Home Financials for this Owner
Home Financials are based on the most recent Mortgage that was taken out on this home.
Original Mortgage
$50,000
Interest Rate
6.87%
Mortgage Type
Purchase Money Mortgage
Create a Home Valuation Report for This Property
The Home Valuation Report is an in-depth analysis detailing your home's value as well as a comparison with similar homes in the area
Home Values in the Area
Average Home Value in this Area
Purchase History
| Date | Buyer | Sale Price | Title Company |
|---|---|---|---|
| Fink Lloyd Thomas | $2,100 | Attorney | |
| Fink Lloyd Thomas | $137,500 | -- |
Source: Public Records
Mortgage History
| Date | Status | Borrower | Loan Amount |
|---|---|---|---|
| Previous Owner | Fink Lloyd Thomas | $50,000 |
Source: Public Records
Tax History
| Year | Tax Paid | Tax Assessment Tax Assessment Total Assessment is a certain percentage of the fair market value that is determined by local assessors to be the total taxable value of land and additions on the property. | Land | Improvement |
|---|---|---|---|---|
| 2025 | $2,880 | $94,530 | $20,560 | $73,970 |
| 2024 | $2,812 | $75,660 | $17,650 | $58,010 |
| 2023 | $2,812 | $75,660 | $17,650 | $58,010 |
| 2022 | $2,840 | $75,660 | $17,650 | $58,010 |
| 2021 | $2,316 | $55,000 | $14,120 | $40,880 |
| 2020 | $2,318 | $55,000 | $14,120 | $40,880 |
| 2019 | $2,362 | $55,000 | $14,120 | $40,880 |
| 2018 | $2,398 | $53,710 | $10,950 | $42,760 |
| 2017 | $2,056 | $49,078 | $10,952 | $38,126 |
| 2016 | $2,042 | $49,078 | $10,952 | $38,126 |
| 2015 | $1,941 | $48,556 | $10,430 | $38,126 |
| 2014 | $1,941 | $48,556 | $10,430 | $38,126 |
| 2013 | $1,896 | $48,556 | $10,430 | $38,126 |
Source: Public Records
Map
Nearby Homes
- 3942 Harris Ln
- 1503 Kingsgate Rd
- 1500 Kingsgate Rd Unit 19430
- 1502 Kingsgate Rd Unit 19432
- 1500 Kingsgate Rd
- 1509 Kingsgate Rd
- 1502 Kingsgate Rd
- 1505 Kingsgate Rd
- 3631 Kingsgate Ln
- 1711 Pinehurst Dr
- 1507 Kingsgate Rd
- 1921 Elaina Dr
- 1811 Saint Andrews Ct
- 4256 Midfield St Unit 9
- 1201 Kingsgate Rd
- 1162 Kingsgate Rd
- 4322 Midfield St Unit 15
- 1341 Student Ave
- 4446 Ridgewood Rd E Unit 3
- 4028 Ryland Dr Unit 4028
Your Personal Tour Guide
Ask me questions while you tour the home.