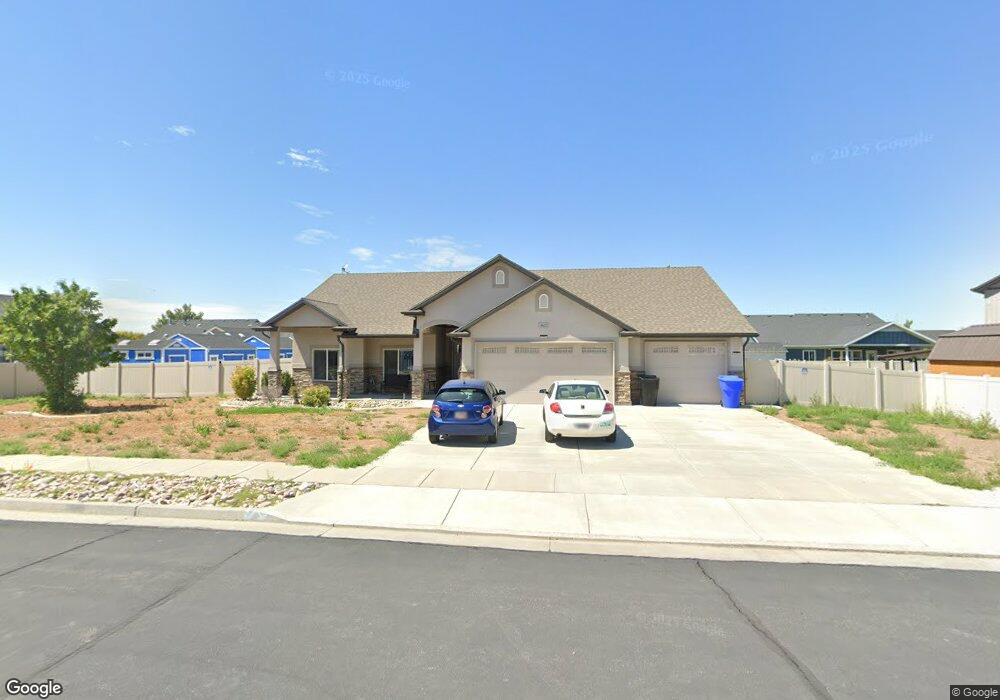
3923 N 2650 W Farr West, UT 84404
Estimated Value: $520,000 - $600,344
3
Beds
2
Baths
1,783
Sq Ft
$317/Sq Ft
Est. Value
About This Home
This home is located at 3923 N 2650 W, Farr West, UT 84404 and is currently estimated at $566,086, approximately $317 per square foot. 3923 N 2650 W is a home located in Weber County with nearby schools including Wahlquist Junior High School and Fremont High School.
Ownership History
Date
Name
Owned For
Owner Type
Purchase Details
Closed on
Jul 2, 2013
Sold by
W & W Properties Lc
Bought by
Farr Kipley A and Farr Glenda P
Current Estimated Value
Home Financials for this Owner
Home Financials are based on the most recent Mortgage that was taken out on this home.
Original Mortgage
$255,415
Interest Rate
3.57%
Mortgage Type
Purchase Money Mortgage
Create a Home Valuation Report for This Property
The Home Valuation Report is an in-depth analysis detailing your home's value as well as a comparison with similar homes in the area
Home Values in the Area
Average Home Value in this Area
Purchase History
| Date | Buyer | Sale Price | Title Company |
|---|---|---|---|
| Farr Kipley A | -- | Mountain View Title Ogden |
Source: Public Records
Mortgage History
| Date | Status | Borrower | Loan Amount |
|---|---|---|---|
| Previous Owner | Farr Kipley A | $255,415 |
Source: Public Records
Tax History Compared to Growth
Tax History
| Year | Tax Paid | Tax Assessment Tax Assessment Total Assessment is a certain percentage of the fair market value that is determined by local assessors to be the total taxable value of land and additions on the property. | Land | Improvement |
|---|---|---|---|---|
| 2025 | $3,319 | $508,509 | $200,613 | $307,896 |
| 2024 | $3,432 | $275,549 | $110,337 | $165,212 |
| 2023 | $3,553 | $288,750 | $110,144 | $178,606 |
| 2022 | $3,289 | $273,900 | $82,729 | $191,171 |
| 2021 | $2,839 | $389,000 | $105,358 | $283,642 |
| 2020 | $2,726 | $341,000 | $90,355 | $250,645 |
| 2019 | $2,621 | $307,000 | $70,272 | $236,728 |
| 2018 | $2,573 | $288,000 | $70,272 | $217,728 |
| 2017 | $2,348 | $250,000 | $70,195 | $179,805 |
| 2016 | $2,119 | $119,659 | $35,755 | $83,904 |
| 2015 | $2,532 | $147,251 | $32,980 | $114,271 |
| 2014 | $2,292 | $126,926 | $27,560 | $99,366 |
Source: Public Records
Map
Nearby Homes
- 3059 N 2825 W
- 3533 Remuda Dr
- 3524 N 3000 W
- 1158 3425 N Unit 212
- 3356 N 2900 W
- 3274 2500 W
- 3261 2500 W
- 3268 2425 W
- 2830 W North Plain City Rd
- 2878 W North Plain City Rd
- 2405 W 3200 N
- 2417 W 3200 N
- 3158 W North Plain City Rd
- 3221 N 2875 W Unit 33
- 3202 N 2875 W Unit 39
- 3209 N 2875 W Unit 34
- 3190 N 2875 W Unit 38
- 3215 Saddlebrook Ln Unit 319
- 3198 N 3475 W
- 2508 W 3000 N
- 3908 N 2700 W
- 2660 W 3900 N
- 3937 N 2650 W
- 3924 N 2700 W
- 3930 N 2650 W
- 3930 N 2650 W Unit 4
- 3938 N 2700 W
- 3916 N 2650 W
- 3916 N 2650 W Unit 5
- 3942 N 2650 W
- 3929 N 2700 W
- 2655 W 3900 N
- 3915 N 2700 W
- 2662 W 3950 N
- 2677 W 3900 N
- 3904 N 2650 W
- 3904 N 2650 W Unit 3
- 2694 W 3950 N
- 3943 N 2700 W Unit 19
- 3943 N 2700 W