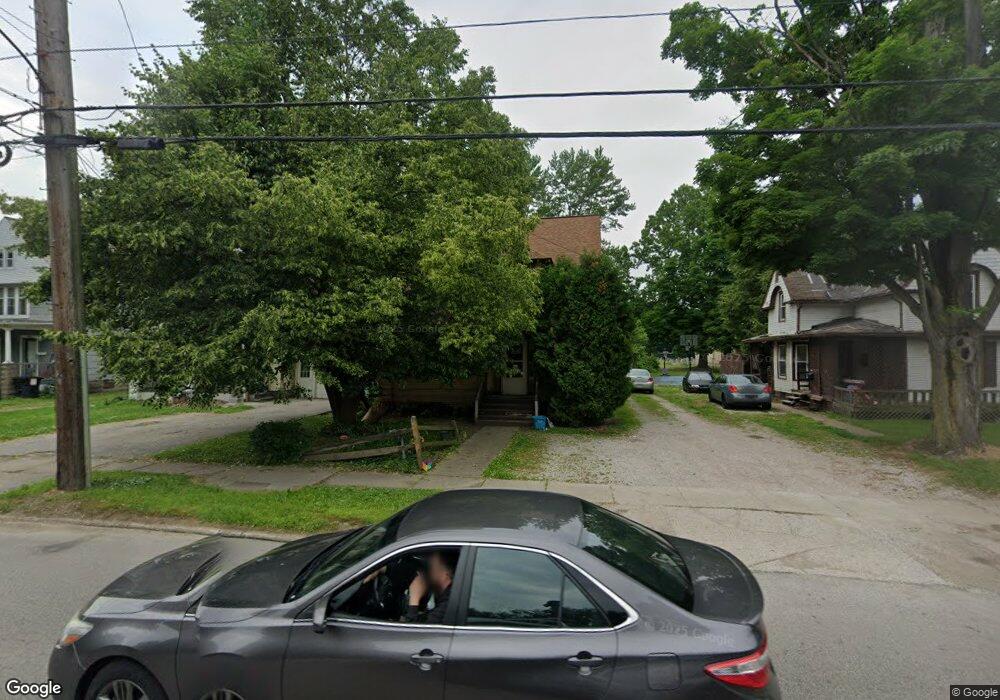
3923 State Rd Ashtabula, OH 44004
Estimated Value: $113,000 - $196,000
3
Beds
2
Baths
1,679
Sq Ft
$87/Sq Ft
Est. Value
About This Home
This home is located at 3923 State Rd, Ashtabula, OH 44004 and is currently estimated at $146,888, approximately $87 per square foot. 3923 State Rd is a home located in Ashtabula County with nearby schools including Ridgeview Elementary School, Kingsville Elementary School, and Wallace H. Braden Junior High School.
Ownership History
Date
Name
Owned For
Owner Type
Purchase Details
Closed on
Mar 26, 2003
Sold by
Flood Patrick J
Bought by
Flood Yvonne M
Current Estimated Value
Home Financials for this Owner
Home Financials are based on the most recent Mortgage that was taken out on this home.
Original Mortgage
$47,450
Interest Rate
5.71%
Create a Home Valuation Report for This Property
The Home Valuation Report is an in-depth analysis detailing your home's value as well as a comparison with similar homes in the area
Home Values in the Area
Average Home Value in this Area
Purchase History
| Date | Buyer | Sale Price | Title Company |
|---|---|---|---|
| Flood Yvonne M | -- | Expedient Title Ltd |
Source: Public Records
Mortgage History
| Date | Status | Borrower | Loan Amount |
|---|---|---|---|
| Closed | Flood Yvonne M | $47,450 |
Source: Public Records
Tax History
| Year | Tax Paid | Tax Assessment Tax Assessment Total Assessment is a certain percentage of the fair market value that is determined by local assessors to be the total taxable value of land and additions on the property. | Land | Improvement |
|---|---|---|---|---|
| 2024 | $1,736 | $19,640 | $5,430 | $14,210 |
| 2023 | $1,246 | $19,640 | $5,430 | $14,210 |
| 2022 | $1,055 | $14,320 | $4,170 | $10,150 |
| 2021 | $1,341 | $14,320 | $4,170 | $10,150 |
| 2020 | $747 | $14,320 | $4,170 | $10,150 |
| 2019 | $992 | $17,780 | $2,800 | $14,980 |
| 2018 | $961 | $17,780 | $2,800 | $14,980 |
| 2017 | $1,260 | $17,780 | $2,800 | $14,980 |
| 2016 | $997 | $19,110 | $3,010 | $16,100 |
| 2015 | $2,848 | $19,110 | $3,010 | $16,100 |
| 2014 | $4,036 | $19,110 | $3,010 | $16,100 |
| 2013 | $15,664 | $26,250 | $3,500 | $22,750 |
Source: Public Records
Map
Nearby Homes
- 4016 State Rd
- 4211 Birchwood Ave
- 4320 Birchwood Ave
- 2124 E 40th St
- 4422 State Rd
- 4422 Rodgers Rd
- 2130 E 44th St
- 1629 E 47th St
- 4211 Park Ave
- 3129 Lincoln Dr
- 3024 Latimer Ave
- 3003 Blair Ave
- 3001 Blair Ave
- 3835 Lake Ave
- 3829 Lake Ave
- 3033 Avon Blvd
- 3603 Silvieus Dr
- 1930 E 52nd St
- 5031 Blakeslee Ave
- 3038 Eureka Rd
Your Personal Tour Guide
Ask me questions while you tour the home.