Estimated Value: $469,531 - $557,000
4
Beds
3
Baths
2,410
Sq Ft
$210/Sq Ft
Est. Value
About This Home
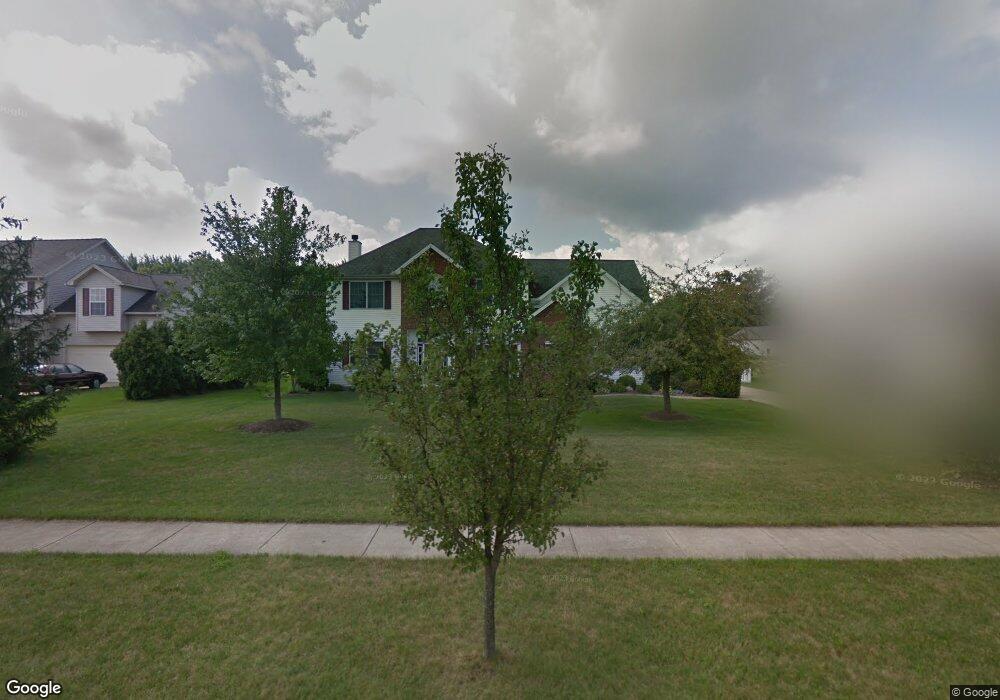
This home is located at 39235 Camelot Way, Avon, OH 44011 and is currently estimated at $506,633, approximately $210 per square foot. 39235 Camelot Way is a home located in Lorain County with nearby schools including Avon Heritage South Elementary School, Avon East Elementary School, and Avon Middle School.
Ownership History
Date
Name
Owned For
Owner Type
Purchase Details
Closed on
Aug 18, 2023
Sold by
Zagorski Benjamin P and Zagorski Sharon T
Bought by
Sharon T Zagorski Family Trust and Zagorski
Current Estimated Value
Purchase Details
Closed on
Jul 20, 1998
Sold by
Muzzy Judith A
Bought by
Zagorski Benjamin P and Zagorski Sharon T
Home Financials for this Owner
Home Financials are based on the most recent Mortgage that was taken out on this home.
Original Mortgage
$140,000
Interest Rate
7.15%
Create a Home Valuation Report for This Property
The Home Valuation Report is an in-depth analysis detailing your home's value as well as a comparison with similar homes in the area
Home Values in the Area
Average Home Value in this Area
Purchase History
| Date | Buyer | Sale Price | Title Company |
|---|---|---|---|
| Sharon T Zagorski Family Trust | -- | City Title | |
| Zagorski Benjamin P | $46,500 | Midland Title |
Source: Public Records
Mortgage History
| Date | Status | Borrower | Loan Amount |
|---|---|---|---|
| Previous Owner | Zagorski Benjamin P | $140,000 |
Source: Public Records
Tax History Compared to Growth
Tax History
| Year | Tax Paid | Tax Assessment Tax Assessment Total Assessment is a certain percentage of the fair market value that is determined by local assessors to be the total taxable value of land and additions on the property. | Land | Improvement |
|---|---|---|---|---|
| 2024 | $7,228 | $147,032 | $42,000 | $105,032 |
| 2023 | $6,348 | $114,755 | $31,833 | $82,922 |
| 2022 | $6,288 | $114,755 | $31,833 | $82,922 |
| 2021 | $6,301 | $114,755 | $31,833 | $82,922 |
| 2020 | $5,869 | $100,320 | $27,830 | $72,490 |
| 2019 | $5,749 | $100,320 | $27,830 | $72,490 |
| 2018 | $5,336 | $100,320 | $27,830 | $72,490 |
| 2017 | $5,345 | $93,780 | $22,150 | $71,630 |
| 2016 | $5,407 | $93,780 | $22,150 | $71,630 |
| 2015 | $5,461 | $93,780 | $22,150 | $71,630 |
| 2014 | $4,758 | $82,400 | $19,460 | $62,940 |
| 2013 | $4,785 | $82,400 | $19,460 | $62,940 |
Source: Public Records
Map
Nearby Homes
- 39006 Steeple Chase
- 39340 Evergreen Dr
- 38661 Country Meadow Way
- 5442 Fountain Cir
- 38506 Misty Meadow Trail
- 38080 Vista Lake Way
- 37972 Avalon Dr
- 5514 Detroit Rd
- 5373 Deer Crossing
- 5437 Deer Lake Dr
- 243 Pepperdine Dr
- 5223 Parkhurst Dr Unit 9C
- 921 Rosewood Dr
- 3473 Moon Rd
- 0 Long Rd
- 38471 Otten Rd
- 4233 Berkeley Dr
- 3292 Fairview Dr
- Lyndhurst Plan at North Ridge Pointe
- Alden Plan at North Ridge Pointe
- 39257 Camelot Way
- 39211 Camelot Way
- 39263 Camelot Way
- 39193 Camelot Way
- 39242 Camelot Way
- 39226 Camelot Way
- 4865 Case Rd
- 39200 Camelot Way
- 39179 Camelot Way
- 39264 Camelot Way
- 39279 Camelot Way
- 39184 Camelot Way
- 4725 Arabian Ct
- 39157 Camelot Way
- 39280 Camelot Way
- 4915 Case Rd
- 4724 Derby Dr
- 4771 Derby Dr
- 4715 Arabian Ct
- 4722 Arabian Ct