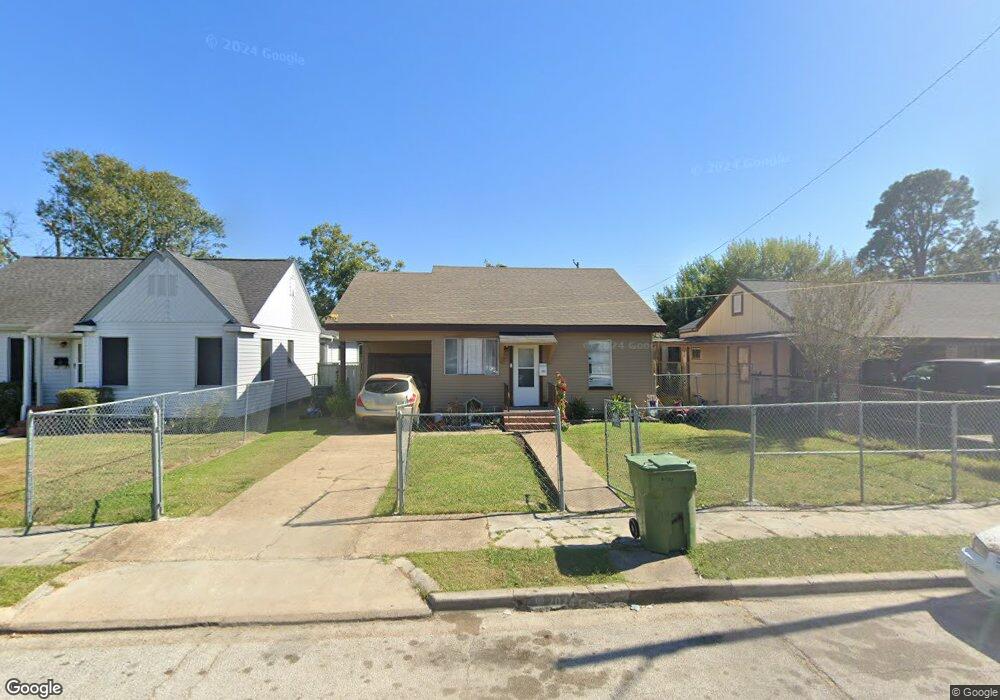
3924 11th St Port Arthur, TX 77642
Estimated Value: $57,000 - $153,000
--
Bed
--
Bath
1,502
Sq Ft
$59/Sq Ft
Est. Value
About This Home
This home is located at 3924 11th St, Port Arthur, TX 77642 and is currently estimated at $89,157, approximately $59 per square foot. 3924 11th St is a home located in Jefferson County with nearby schools including Lakeview Elementary School, Jefferson Middle School, and Memorial High School.
Ownership History
Date
Name
Owned For
Owner Type
Purchase Details
Closed on
Jun 15, 2020
Sold by
Rodriguez Jesus Pulido and Rodriguez Ma Figueroa
Bought by
Rodriguez Daniel Pulido and Rocha Guadalupe
Current Estimated Value
Home Financials for this Owner
Home Financials are based on the most recent Mortgage that was taken out on this home.
Original Mortgage
$67,000
Outstanding Balance
$59,279
Interest Rate
3.1%
Mortgage Type
Unknown
Estimated Equity
$29,878
Purchase Details
Closed on
Oct 19, 2015
Sold by
Hernandez Nadia C
Bought by
Pulido Jesus and Figueroa Ma Rodriguez
Create a Home Valuation Report for This Property
The Home Valuation Report is an in-depth analysis detailing your home's value as well as a comparison with similar homes in the area
Home Values in the Area
Average Home Value in this Area
Purchase History
| Date | Buyer | Sale Price | Title Company |
|---|---|---|---|
| Rodriguez Daniel Pulido | -- | None Available | |
| Pulido Jesus | -- | None Available |
Source: Public Records
Mortgage History
| Date | Status | Borrower | Loan Amount |
|---|---|---|---|
| Open | Rodriguez Daniel Pulido | $67,000 |
Source: Public Records
Tax History Compared to Growth
Tax History
| Year | Tax Paid | Tax Assessment Tax Assessment Total Assessment is a certain percentage of the fair market value that is determined by local assessors to be the total taxable value of land and additions on the property. | Land | Improvement |
|---|---|---|---|---|
| 2025 | $2,280 | $83,682 | $6,250 | $77,432 |
| 2024 | $2,280 | $83,173 | $2,375 | $80,798 |
| 2023 | $2,280 | $66,340 | $2,375 | $63,965 |
| 2022 | $2,107 | $66,340 | $2,375 | $63,965 |
| 2021 | $1,802 | $54,376 | $2,375 | $52,001 |
| 2020 | $0 | $21,486 | $2,375 | $19,111 |
| 2019 | $590 | $20,130 | $2,380 | $17,750 |
| 2018 | $0 | $20,130 | $2,380 | $17,750 |
| 2017 | $0 | $20,130 | $2,380 | $17,750 |
| 2016 | $590 | $20,130 | $2,380 | $17,750 |
| 2015 | $316 | $20,130 | $2,380 | $17,750 |
| 2014 | $316 | $20,130 | $2,380 | $17,750 |
Source: Public Records
Map
Nearby Homes