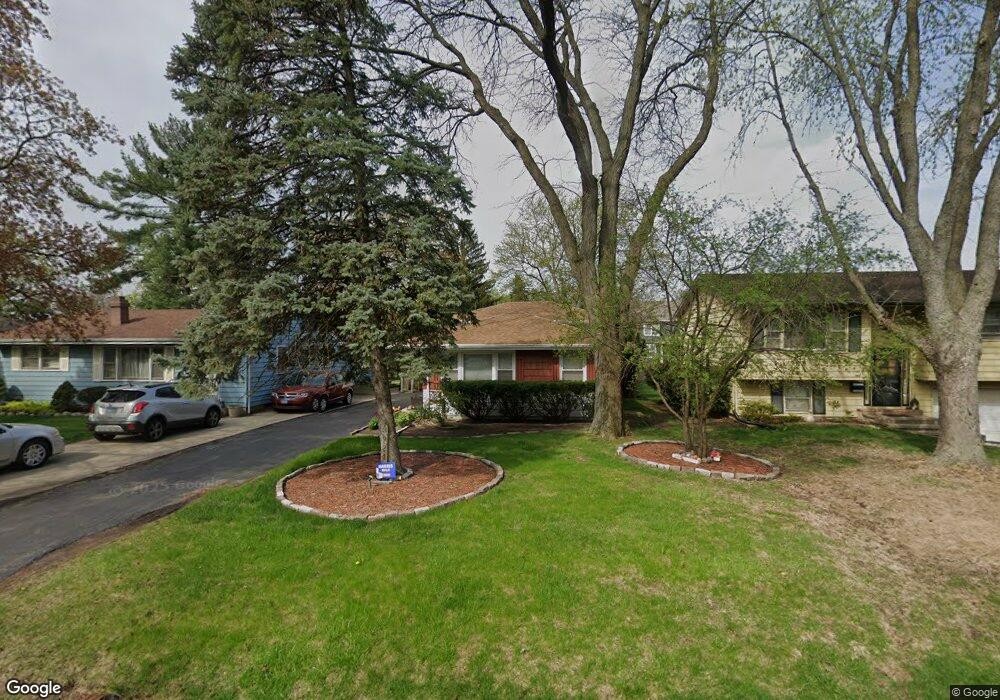
3924 Elm St Downers Grove, IL 60515
Estimated Value: $421,000 - $483,000
3
Beds
2
Baths
1,400
Sq Ft
$325/Sq Ft
Est. Value
About This Home
This home is located at 3924 Elm St, Downers Grove, IL 60515 and is currently estimated at $454,751, approximately $324 per square foot. 3924 Elm St is a home located in DuPage County with nearby schools including Highland Elementary School, Herrick Middle School, and Downer Grove North High School.
Ownership History
Date
Name
Owned For
Owner Type
Purchase Details
Closed on
Aug 30, 2021
Sold by
Ropro 7 Llc 3924 S Elm St
Bought by
Lambert Keith M and King Charmagne Monique
Current Estimated Value
Home Financials for this Owner
Home Financials are based on the most recent Mortgage that was taken out on this home.
Original Mortgage
$319,113
Outstanding Balance
$289,936
Interest Rate
2.7%
Mortgage Type
FHA
Estimated Equity
$164,815
Purchase Details
Closed on
Aug 30, 2012
Sold by
Rhoades Bruce R and Rhoades Diana
Bought by
Ropro 7 Llc 3924 S Elm
Purchase Details
Closed on
Dec 10, 2003
Sold by
Chicago Title Land Trust Co
Bought by
Rhoades Bruce R and Rhoades Diana
Purchase Details
Closed on
Aug 18, 2003
Sold by
Ivik Paul
Bought by
Fifth Third Bank and Trust #17056
Purchase Details
Closed on
Jan 25, 2000
Sold by
Ivik Paul and Ivik Helen H
Bought by
Ivik Helen S
Create a Home Valuation Report for This Property
The Home Valuation Report is an in-depth analysis detailing your home's value as well as a comparison with similar homes in the area
Home Values in the Area
Average Home Value in this Area
Purchase History
| Date | Buyer | Sale Price | Title Company |
|---|---|---|---|
| Lambert Keith M | $325,000 | North American Title Company | |
| Ropro 7 Llc 3924 S Elm | -- | Ctic | |
| Rhoades Bruce R | $207,000 | -- | |
| Fifth Third Bank | $145,000 | First American Title | |
| Ivik Helen S | -- | -- |
Source: Public Records
Mortgage History
| Date | Status | Borrower | Loan Amount |
|---|---|---|---|
| Open | Lambert Keith M | $319,113 |
Source: Public Records
Tax History Compared to Growth
Tax History
| Year | Tax Paid | Tax Assessment Tax Assessment Total Assessment is a certain percentage of the fair market value that is determined by local assessors to be the total taxable value of land and additions on the property. | Land | Improvement |
|---|---|---|---|---|
| 2024 | $6,328 | $118,538 | $47,374 | $71,164 |
| 2023 | $6,002 | $108,970 | $43,550 | $65,420 |
| 2022 | $5,398 | $97,720 | $41,040 | $56,680 |
| 2021 | $5,386 | $96,610 | $40,570 | $56,040 |
| 2020 | $5,291 | $94,700 | $39,770 | $54,930 |
| 2019 | $5,132 | $90,870 | $38,160 | $52,710 |
| 2018 | $4,773 | $83,510 | $37,910 | $45,600 |
| 2017 | $4,284 | $80,360 | $36,480 | $43,880 |
| 2016 | $4,193 | $76,700 | $34,820 | $41,880 |
| 2015 | $4,138 | $72,160 | $32,760 | $39,400 |
| 2014 | $3,953 | $67,320 | $31,850 | $35,470 |
| 2013 | $3,871 | $67,000 | $31,700 | $35,300 |
Source: Public Records
Map
Nearby Homes
- 3919 Washington St
- 3910 Sterling Rd
- 4133 Lindley St
- 3730 Sterling Rd
- 4225 Highland Ave
- Lot 3910 Sterling Rd
- 4043 Saratoga Ave Unit D221
- 4117 Sterling Rd
- 4224 Saratoga Ave Unit 105
- 4250 Saratoga Ave Unit 305
- 4224 Saratoga Ave Unit 110
- 4111 Douglas Rd
- 4133 Saratoga Ave Unit B220
- 1136 Barneswood Dr
- 525 36th St
- 4218 Florence Ave
- 248 41st St
- 727 Grant St
- 425 Sherman St
- 1219 Ogden Ave