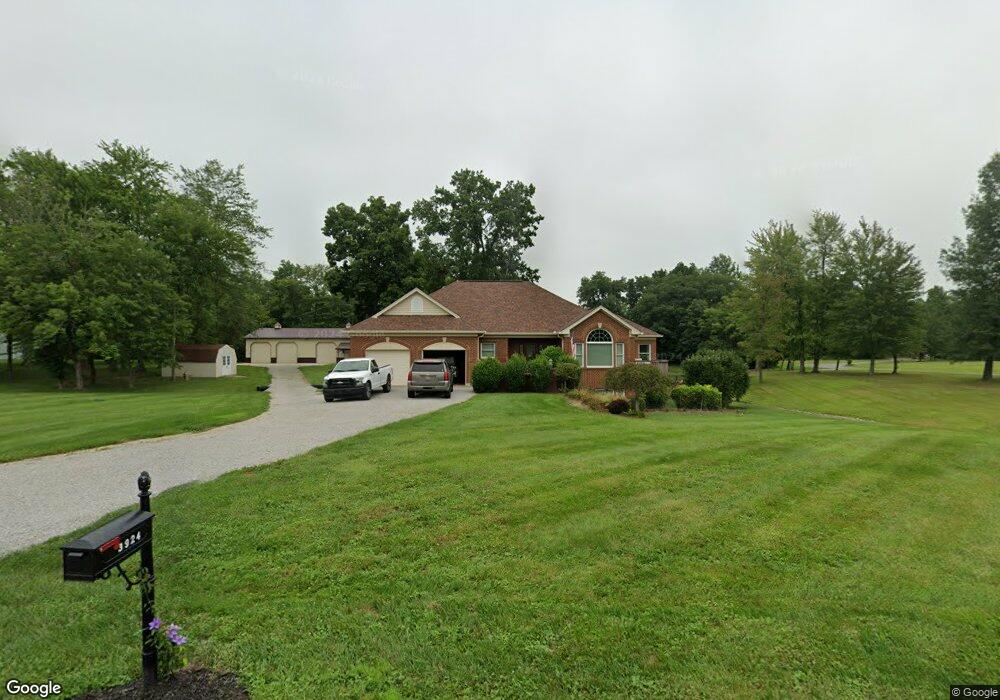
3924 Forest View Williamsburg, OH 45176
Estimated Value: $535,000 - $749,000
3
Beds
3
Baths
3,692
Sq Ft
$168/Sq Ft
Est. Value
About This Home
This home is located at 3924 Forest View, Williamsburg, OH 45176 and is currently estimated at $620,934, approximately $168 per square foot. 3924 Forest View is a home located in Clermont County with nearby schools including Williamsburg Elementary School and Williamsburg High School.
Ownership History
Date
Name
Owned For
Owner Type
Purchase Details
Closed on
Aug 31, 2011
Sold by
Sims Michael W and Sims Nancy
Bought by
Robinson Kenneth R and Robinson Sara R
Current Estimated Value
Home Financials for this Owner
Home Financials are based on the most recent Mortgage that was taken out on this home.
Original Mortgage
$223,200
Outstanding Balance
$155,162
Interest Rate
4.58%
Mortgage Type
New Conventional
Estimated Equity
$465,772
Purchase Details
Closed on
Nov 14, 2007
Sold by
Sims Michael W
Bought by
Sims Michael W and Sims Nancy
Home Financials for this Owner
Home Financials are based on the most recent Mortgage that was taken out on this home.
Original Mortgage
$368,500
Interest Rate
6.47%
Mortgage Type
New Conventional
Purchase Details
Closed on
Aug 14, 2006
Sold by
Sims Gail A
Bought by
Sims Michael W
Home Financials for this Owner
Home Financials are based on the most recent Mortgage that was taken out on this home.
Original Mortgage
$360,000
Interest Rate
9.74%
Mortgage Type
Purchase Money Mortgage
Create a Home Valuation Report for This Property
The Home Valuation Report is an in-depth analysis detailing your home's value as well as a comparison with similar homes in the area
Purchase History
| Date | Buyer | Sale Price | Title Company |
|---|---|---|---|
| Robinson Kenneth R | $235,000 | Attorney | |
| Sims Michael W | -- | Attorney | |
| Sims Michael W | -- | None Available |
Source: Public Records
Mortgage History
| Date | Status | Borrower | Loan Amount |
|---|---|---|---|
| Open | Robinson Kenneth R | $223,200 | |
| Previous Owner | Sims Michael W | $368,500 | |
| Previous Owner | Sims Michael W | $360,000 |
Source: Public Records
Tax History
| Year | Tax Paid | Tax Assessment Tax Assessment Total Assessment is a certain percentage of the fair market value that is determined by local assessors to be the total taxable value of land and additions on the property. | Land | Improvement |
|---|---|---|---|---|
| 2024 | $5,365 | $134,410 | $28,950 | $105,460 |
| 2023 | $5,374 | $134,410 | $28,950 | $105,460 |
| 2022 | $4,968 | $111,730 | $23,630 | $88,100 |
| 2021 | $4,420 | $111,730 | $23,630 | $88,100 |
| 2020 | $4,901 | $123,660 | $23,630 | $100,030 |
| 2019 | $4,064 | $100,070 | $23,770 | $76,300 |
| 2018 | $4,074 | $100,070 | $23,770 | $76,300 |
| 2017 | $4,033 | $100,070 | $23,770 | $76,300 |
| 2016 | $4,033 | $87,010 | $20,650 | $66,360 |
| 2015 | $3,881 | $87,010 | $20,650 | $66,360 |
| 2014 | $3,881 | $87,010 | $20,650 | $66,360 |
| 2013 | $4,359 | $96,120 | $24,050 | $72,070 |
Source: Public Records
Map
Nearby Homes
- 4540 Ireton Rd
- 1571 County Highway 8a
- 16086 Colonial Dr
- 16573 Pine Valley Dr
- 3518 Island Trail Dr
- Acres Dela Palma Rd
- 3717 Cobb Rd
- 1 Greenbush West Rd
- 0 Steward Harbough Rd Unit 1839956
- 15270 Karampas Ln
- 192 N Broadway St
- 171 N 4th St
- 134 N Front St
- 129 S 3rd St
- 130 Cornerstone Dr
- 126 Cornerstone Dr
- 15768 Bodman Rd
- 124 Cornerstone Dr
- 122 Cornerstone Dr
- Harmony Plan at Cornerstone Crossing
- 3921 Pine View
- 3920 Pine View
- 11 Turtles View
- 3922 Pine View
- ac Turtles View
- 5 Turtles View
- 3925 Forest View
- 3905 Turtle View
- 3905 Turtle View
- 3904 Turtles View
- 4640 Ireton Rd
- 1387 Zimmer Rd
- 3902 Turtle View
- 14 Turtles View
- 3 ac Ireton Rd
- 4639 Ireton Rd
- 4653 Ireton Rd
- 1414 Zimmer Rd
- 3820 Percy Ln
- 4632 Ireton Rd
Your Personal Tour Guide
Ask me questions while you tour the home.