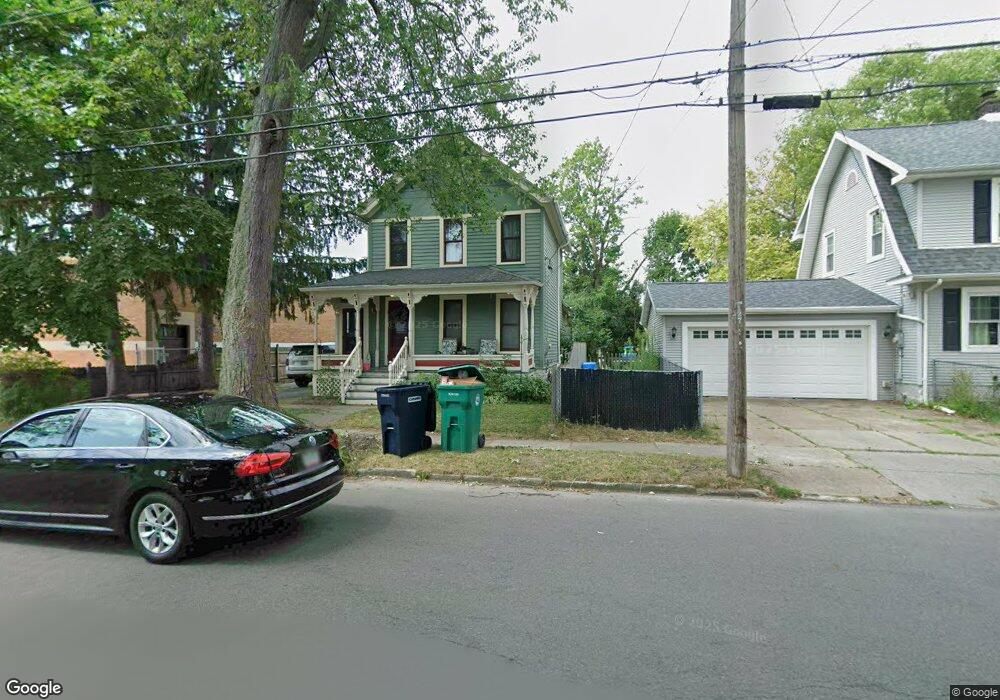
3924 McKoon Ave Niagara Falls, NY 14305
North End NeighborhoodEstimated Value: $198,000 - $238,000
4
Beds
2
Baths
1,674
Sq Ft
$126/Sq Ft
Est. Value
About This Home
This home is located at 3924 McKoon Ave, Niagara Falls, NY 14305 and is currently estimated at $211,641, approximately $126 per square foot. 3924 McKoon Ave is a home located in Niagara County with nearby schools including Niagara Falls High School, Sacred Heart Villa School, and St. Joseph Elementary School.
Ownership History
Date
Name
Owned For
Owner Type
Purchase Details
Closed on
Jan 31, 2020
Sold by
Abrams Corinne E and Cech Cory M
Bought by
Abrams Corinne E
Current Estimated Value
Home Financials for this Owner
Home Financials are based on the most recent Mortgage that was taken out on this home.
Original Mortgage
$73,000
Outstanding Balance
$57,326
Interest Rate
3.6%
Mortgage Type
New Conventional
Estimated Equity
$154,315
Purchase Details
Closed on
May 6, 2014
Sold by
Selkowitz Robert and Levin Abigail
Bought by
Cech Cory M and Abrams Corinne E
Home Financials for this Owner
Home Financials are based on the most recent Mortgage that was taken out on this home.
Original Mortgage
$79,000
Interest Rate
4.42%
Mortgage Type
New Conventional
Purchase Details
Closed on
Jul 12, 2007
Sold by
Kelly Sean Q Rajmaira Sheen
Bought by
Selkowitz Robert
Purchase Details
Closed on
Jun 17, 1999
Sold by
Sarkees John Reid Meredith Rei
Bought by
Kelly Sean W and Rajamira Sheen
Create a Home Valuation Report for This Property
The Home Valuation Report is an in-depth analysis detailing your home's value as well as a comparison with similar homes in the area
Home Values in the Area
Average Home Value in this Area
Purchase History
| Date | Buyer | Sale Price | Title Company |
|---|---|---|---|
| Abrams Corinne E | -- | None Available | |
| Cech Cory M | $88,000 | None Available | |
| Selkowitz Robert | $114,000 | Karl Frankovitch | |
| Kelly Sean W | $80,000 | -- |
Source: Public Records
Mortgage History
| Date | Status | Borrower | Loan Amount |
|---|---|---|---|
| Open | Abrams Corinne E | $73,000 | |
| Closed | Cech Cory M | $79,000 |
Source: Public Records
Tax History
| Year | Tax Paid | Tax Assessment Tax Assessment Total Assessment is a certain percentage of the fair market value that is determined by local assessors to be the total taxable value of land and additions on the property. | Land | Improvement |
|---|---|---|---|---|
| 2024 | $3,892 | $72,400 | $6,900 | $65,500 |
| 2023 | $2,090 | $72,400 | $6,900 | $65,500 |
| 2022 | $1,724 | $72,400 | $6,900 | $65,500 |
| 2021 | $1,700 | $72,400 | $6,900 | $65,500 |
| 2020 | $1,191 | $72,400 | $6,900 | $65,500 |
| 2019 | $1,349 | $72,400 | $6,900 | $65,500 |
| 2018 | $1,608 | $72,400 | $6,900 | $65,500 |
| 2017 | $1,349 | $72,400 | $6,900 | $65,500 |
| 2016 | $1,778 | $72,400 | $6,900 | $65,500 |
| 2015 | -- | $72,400 | $6,900 | $65,500 |
Source: Public Records
Map
Nearby Homes
- 4006 Deveaux St
- 3817 Deveaux St
- 4021 Bell St
- 1315 Maple Ave
- 4140 Lewiston Rd
- 3040 Madison Ave
- 3010 McKoon Ave
- 3402 Highland Ave
- 2975 McKoon Ave
- 2936 McKoon Ave
- 2907 Lewiston Rd
- 4368 Crescent Dr
- 2830 MacKlem Ave
- 720 Monteagle St
- 725 Monteagle St
- 623 Chestnut Ave
- 615 Chestnut Ave
- 2783 McKoon Ave
- 1143 Garden Ave
- 928 Centre Ave
- 1011 Vanderbilt Ave
- 1023 Vanderbilt Ave
- 955 Vanderbilt Ave
- 3925 MacKlem Ave
- 3919 MacKlem Ave
- 968 Vanderbilt Ave
- 949 Vanderbilt Ave
- 3923 McKoon Ave
- 3929 McKoon Ave
- 3931 McKoon Ave
- 4006 McKoon Ave
- 3915 McKoon Ave
- 960 Vanderbilt Ave
- 3913 McKoon Ave
- 4014 McKoon Ave
- 1006 College Ave
- 956 Vanderbilt Ave
- 1002 College Ave
- 954 Vanderbilt Ave
- 1115 Vanderbilt Ave
Your Personal Tour Guide
Ask me questions while you tour the home.