Estimated Value: $661,351 - $1,057,000
2
Beds
1
Bath
1,508
Sq Ft
$533/Sq Ft
Est. Value
About This Home
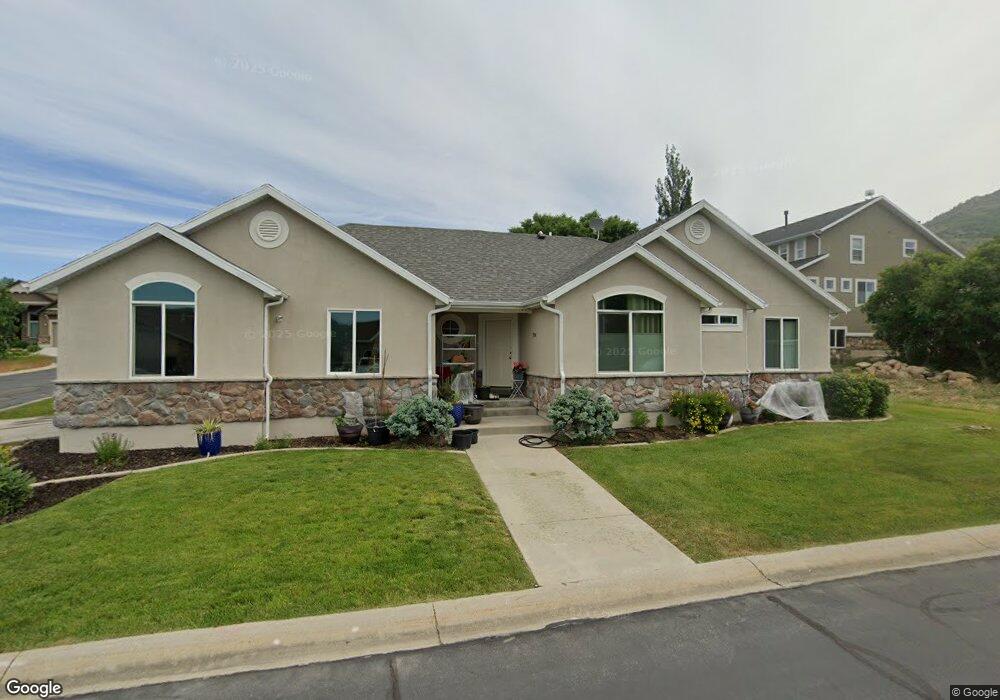
This home is located at 3924 N 4800 E Unit 23, Eden, UT 84310 and is currently estimated at $803,838, approximately $533 per square foot. 3924 N 4800 E Unit 23 is a home located in Weber County with nearby schools including Valley Elementary School, Snowcrest Junior High School, and Weber High School.
Ownership History
Date
Name
Owned For
Owner Type
Purchase Details
Closed on
Dec 3, 2003
Sold by
Spaey Marc C and Spaey Angelika Dorr
Bought by
Spaey Marc C and Spaey Angelika D
Current Estimated Value
Home Financials for this Owner
Home Financials are based on the most recent Mortgage that was taken out on this home.
Original Mortgage
$171,500
Outstanding Balance
$74,559
Interest Rate
5%
Mortgage Type
New Conventional
Estimated Equity
$729,279
Purchase Details
Closed on
Feb 19, 2002
Sold by
Lewis John L
Bought by
Spaey Marc C and Spaey Angelika Dorr
Home Financials for this Owner
Home Financials are based on the most recent Mortgage that was taken out on this home.
Original Mortgage
$171,200
Interest Rate
7.04%
Purchase Details
Closed on
Jul 3, 2001
Sold by
Lewis Homes Inc
Bought by
Lewis John L
Home Financials for this Owner
Home Financials are based on the most recent Mortgage that was taken out on this home.
Original Mortgage
$176,000
Interest Rate
9%
Create a Home Valuation Report for This Property
The Home Valuation Report is an in-depth analysis detailing your home's value as well as a comparison with similar homes in the area
Home Values in the Area
Average Home Value in this Area
Purchase History
| Date | Buyer | Sale Price | Title Company |
|---|---|---|---|
| Spaey Marc C | -- | United Title | |
| Spaey Marc C | -- | -- | |
| Lewis John L | -- | -- |
Source: Public Records
Mortgage History
| Date | Status | Borrower | Loan Amount |
|---|---|---|---|
| Open | Spaey Marc C | $171,500 | |
| Closed | Spaey Marc C | $171,200 | |
| Previous Owner | Lewis John L | $176,000 |
Source: Public Records
Tax History Compared to Growth
Tax History
| Year | Tax Paid | Tax Assessment Tax Assessment Total Assessment is a certain percentage of the fair market value that is determined by local assessors to be the total taxable value of land and additions on the property. | Land | Improvement |
|---|---|---|---|---|
| 2025 | $3,078 | $574,781 | $187,673 | $387,108 |
| 2024 | $2,707 | $283,249 | $87,920 | $195,329 |
| 2023 | $2,376 | $245,110 | $82,430 | $162,680 |
| 2022 | $2,427 | $255,107 | $68,750 | $186,357 |
| 2021 | $1,845 | $326,013 | $85,003 | $241,010 |
| 2020 | $1,800 | $292,000 | $59,914 | $232,086 |
| 2019 | $1,841 | $286,000 | $59,914 | $226,086 |
| 2018 | $1,866 | $278,086 | $59,914 | $218,172 |
| 2017 | $1,673 | $242,279 | $59,914 | $182,365 |
| 2016 | $1,679 | $132,048 | $38,347 | $93,701 |
| 2015 | $1,557 | $120,903 | $38,347 | $82,556 |
| 2014 | $1,528 | $115,923 | $27,422 | $88,501 |
Source: Public Records
Map
Nearby Homes
- 4293 Sunrise Dr
- 3884 N 4975 E Unit B101
- 3880 N 4975 E Unit C207
- 3840 N 4975 E Unit A104
- 3840 N 4975 E Unit A205
- 3727 N Patio Springs Cir
- 4174 N Patio Springs Dr Unit 4
- 6822 E Aspen Ln Unit 29
- 4133 N Wolf Ridge Cir Unit 10
- 3615 N Wolf Lodge Dr Unit 211
- 3615 N Wolf Lodge Dr Unit 402
- 3615 N Wolf Lodge Dr Unit 103
- 3615 N Wolf Dr Unit 309
- 3615 N Wolf Lodge Dr Unit 1401
- 3615 N Wolf Lodge Dr Unit 807
- 3615 N Wolf Lodge Dr Unit 805
- 3615 N Wolf Dr Unit 804
- 3615 N Wolf Creek Dr Unit 709
- 3710 N Foothill Ln
- 5179 E 3900 N Unit 2
- 3924 N 4800 E
- 3932 N 4800 E
- 3932 N 4800 E Unit 22
- 3933 N 4800 E Unit 19
- 3933 N 4825 E
- 3933 N 4825 E Unit 28
- 4805 E 3925 N
- 4782 E 3925 N
- 4791 E 3925 N
- 3946 N 4650 E
- 3946 N 4800 E
- 4819 E 3925 N
- 4825 Fairway Oaks Dr N
- 4825 Fairway Oaks Dr N Unit 27
- 3947 N 4825 E
- 4779 E 3925 N
- 3924 N 4825 E
- 3947 N 4800 E
- 3947 N 4800 E Unit 20
- 4768 E 3925 N