Estimated Value: $792,000 - $1,151,000
3
Beds
2
Baths
3,541
Sq Ft
$255/Sq Ft
Est. Value
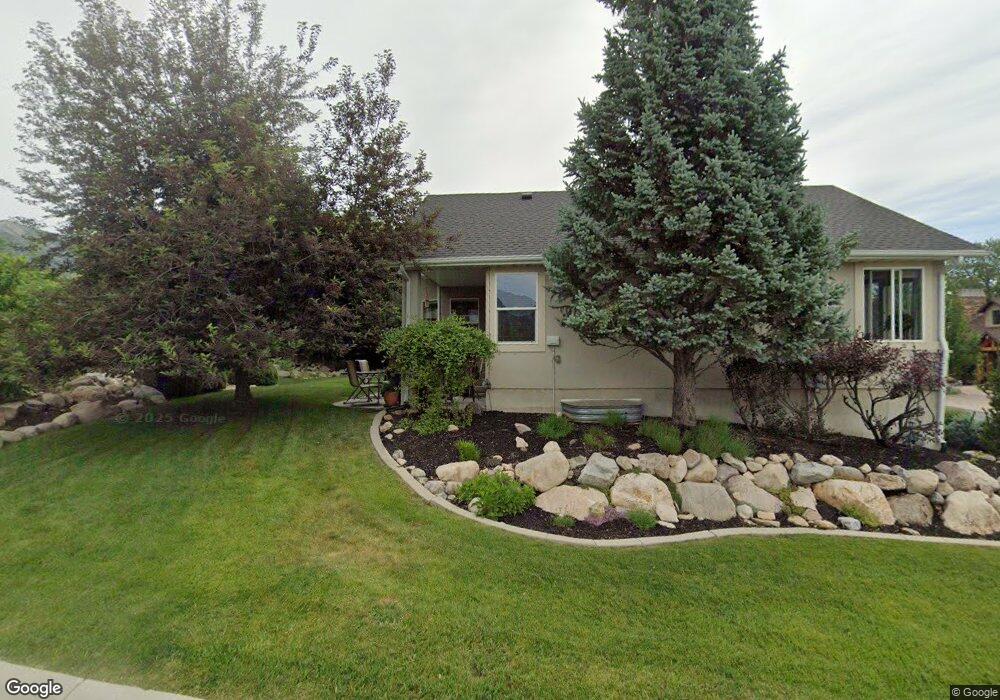
About This Home
This home is located at 3924 N 4825 E, Eden, UT 84310 and is currently estimated at $902,362, approximately $254 per square foot. 3924 N 4825 E is a home located in Weber County with nearby schools including Valley Elementary School, Snowcrest Junior High School, and Weber High School.
Ownership History
Date
Name
Owned For
Owner Type
Purchase Details
Closed on
May 22, 2017
Sold by
Elliott Alan G and Elliott Dorothy M
Bought by
Elliott Preston J and Elliott Investment Trust
Current Estimated Value
Purchase Details
Closed on
Oct 20, 2011
Sold by
Elliott Alan G and Elliott Dorothy M
Bought by
Elliott Alan G and Elliott Dorothy M
Purchase Details
Closed on
Mar 2, 2010
Sold by
Siggelkow Angela
Bought by
Elliott Alan G and Elliott Dorothy M
Home Financials for this Owner
Home Financials are based on the most recent Mortgage that was taken out on this home.
Original Mortgage
$263,500
Outstanding Balance
$174,205
Interest Rate
4.93%
Mortgage Type
New Conventional
Estimated Equity
$728,157
Purchase Details
Closed on
Mar 4, 2005
Sold by
Roszmann David E and Roszmann Amy D
Bought by
Angela Siggelkow Separate Property Revoc
Create a Home Valuation Report for This Property
The Home Valuation Report is an in-depth analysis detailing your home's value as well as a comparison with similar homes in the area
Home Values in the Area
Average Home Value in this Area
Purchase History
| Date | Buyer | Sale Price | Title Company |
|---|---|---|---|
| Elliott Preston J | -- | None Available | |
| Elliott Alan G | -- | Mountain View Title Ogden | |
| Elliott Alan G | -- | None Available | |
| Angela Siggelkow Separate Property Revoc | -- | Mountain View Title Ogden | |
| Angela Siggelkow Separate Property Revoc | -- | Mountain View Title Ogden |
Source: Public Records
Mortgage History
| Date | Status | Borrower | Loan Amount |
|---|---|---|---|
| Open | Elliott Alan G | $263,500 |
Source: Public Records
Tax History
| Year | Tax Paid | Tax Assessment Tax Assessment Total Assessment is a certain percentage of the fair market value that is determined by local assessors to be the total taxable value of land and additions on the property. | Land | Improvement |
|---|---|---|---|---|
| 2025 | $3,835 | $717,296 | $169,826 | $547,470 |
| 2024 | $3,400 | $356,399 | $80,153 | $276,246 |
| 2023 | $3,000 | $310,120 | $75,206 | $234,914 |
| 2022 | $3,124 | $329,095 | $62,950 | $266,145 |
| 2021 | $2,409 | $427,021 | $78,405 | $348,616 |
| 2020 | $2,365 | $385,000 | $55,531 | $329,469 |
| 2019 | $2,419 | $377,000 | $55,531 | $321,469 |
| 2018 | $2,493 | $372,825 | $55,531 | $317,294 |
| 2017 | $2,201 | $320,832 | $55,531 | $265,301 |
| 2016 | $2,403 | $190,469 | $39,403 | $151,066 |
| 2015 | $2,238 | $175,362 | $39,403 | $135,959 |
| 2014 | $2,273 | $174,150 | $28,417 | $145,733 |
Source: Public Records
Map
Nearby Homes
- 3884 N 4975 E Unit B101
- 3880 N 4975 E Unit C207
- 3754 N Willow Brooke Ln
- 3840 N 4975 E Unit A104
- 3840 N 4975 E Unit A205
- 3840 N 4975 E Unit A207
- 4220 Sunrise Dr
- 6822 E Aspen Ln Unit 29
- 3674 N Willow Brooke Ln
- 4117 N Wolf Ridge Cir
- 4133 N Wolf Ridge Cir Unit 10
- 3615 N Wolf Lodge Dr Unit 709
- 3615 N Wolf Lodge Dr Unit 402
- 3615 N Wolf Lodge Dr Unit 103
- 3615 N Wolf Lodge Dr Unit 1401
- 3615 N Wolf Dr Unit 804
- 3615 N Wolf Lodge Dr Unit 306
- 3700 N Foothill Ln
- 5179 E 3900 N Unit 2
- 3669 N Foothill Ln
- 4838 E 3925 N
- 3932 N 4825 E Unit 31
- 3932 N 4825 E
- 3933 N 4825 E
- 3933 N 4825 E Unit 28
- 3938 N 4825 E
- 4833 E 3925 N
- 3948 N 4825 E
- 3948 N 4825 E Unit 30
- 4825 Fairway Oaks Dr N
- 4825 Fairway Oaks Dr N Unit 27
- 4847 E 3925 N
- 4847 E 3925 N Unit 34
- 4819 E 3925 N
- 3947 N 4825 E
- 3924 N 4800 E
- 3924 N 4800 E Unit 23
- 3932 N 4800 E
- 3932 N 4800 E Unit 22
- 4805 E 3925 N
Your Personal Tour Guide
Ask me questions while you tour the home.