3925 Ancroft Cir Unit IIB Norcross, GA 30092
Estimated Value: $543,420 - $627,000
4
Beds
3
Baths
2,504
Sq Ft
$231/Sq Ft
Est. Value
About This Home
This home is located at 3925 Ancroft Cir Unit IIB, Norcross, GA 30092 and is currently estimated at $577,605, approximately $230 per square foot. 3925 Ancroft Cir Unit IIB is a home located in Gwinnett County with nearby schools including Berkeley Lake Elementary School, Duluth Middle School, and Duluth High School.
Ownership History
Date
Name
Owned For
Owner Type
Purchase Details
Closed on
Apr 20, 2017
Sold by
Lin Bin
Bought by
Lin Bin and Jin An
Current Estimated Value
Purchase Details
Closed on
Dec 5, 2009
Sold by
Jin An
Bought by
Lin Bin
Home Financials for this Owner
Home Financials are based on the most recent Mortgage that was taken out on this home.
Original Mortgage
$176,250
Interest Rate
5.02%
Mortgage Type
New Conventional
Purchase Details
Closed on
Jan 18, 2000
Sold by
Or Wai C
Bought by
Lin Bin
Home Financials for this Owner
Home Financials are based on the most recent Mortgage that was taken out on this home.
Original Mortgage
$157,600
Interest Rate
7.9%
Mortgage Type
New Conventional
Purchase Details
Closed on
Dec 21, 1994
Sold by
Pulte Home Corp
Bought by
Or Wai Chung and Wong Yuk Ying
Home Financials for this Owner
Home Financials are based on the most recent Mortgage that was taken out on this home.
Original Mortgage
$103,050
Interest Rate
9.17%
Create a Home Valuation Report for This Property
The Home Valuation Report is an in-depth analysis detailing your home's value as well as a comparison with similar homes in the area
Home Values in the Area
Average Home Value in this Area
Purchase History
| Date | Buyer | Sale Price | Title Company |
|---|---|---|---|
| Lin Bin | -- | -- | |
| Lin Bin | -- | -- | |
| Lin Bin | $197,000 | -- | |
| Or Wai Chung | $171,900 | -- |
Source: Public Records
Mortgage History
| Date | Status | Borrower | Loan Amount |
|---|---|---|---|
| Previous Owner | Lin Bin | $176,250 | |
| Previous Owner | Lin Bin | $157,600 | |
| Previous Owner | Or Wai Chung | $103,050 |
Source: Public Records
Tax History Compared to Growth
Tax History
| Year | Tax Paid | Tax Assessment Tax Assessment Total Assessment is a certain percentage of the fair market value that is determined by local assessors to be the total taxable value of land and additions on the property. | Land | Improvement |
|---|---|---|---|---|
| 2025 | -- | $196,000 | $38,400 | $157,600 |
| 2024 | $1,214 | $196,000 | $38,400 | $157,600 |
| 2023 | $1,214 | $211,840 | $38,400 | $173,440 |
| 2022 | $0 | $200,760 | $34,800 | $165,960 |
| 2021 | $1,199 | $158,400 | $27,760 | $130,640 |
| 2020 | $1,098 | $143,280 | $24,000 | $119,280 |
| 2019 | $1,098 | $143,280 | $24,000 | $119,280 |
| 2018 | $3,720 | $123,160 | $22,000 | $101,160 |
| 2016 | $3,310 | $106,040 | $16,000 | $90,040 |
| 2015 | $3,342 | $106,040 | $16,000 | $90,040 |
| 2014 | $3,127 | $101,800 | $16,000 | $85,800 |
Source: Public Records
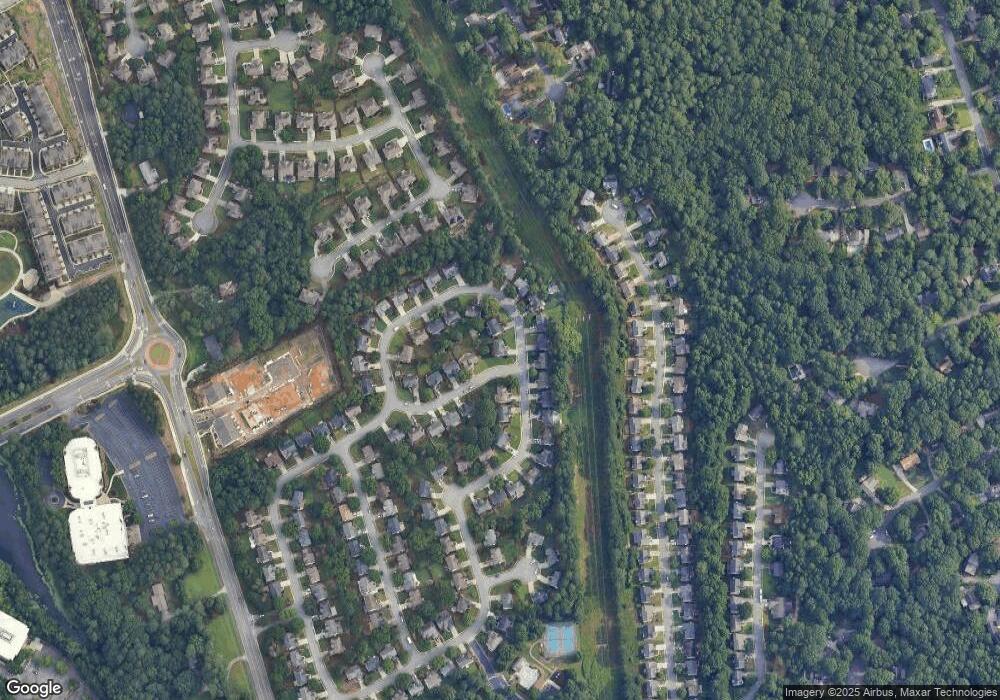
Map
Nearby Homes
- 3875 Ancroft Cir
- 5064 Insperon Ln Unit 34
- Olmstead Plan at Town Center Overlook
- Lynnwood Plan at Town Center Overlook
- 5018 Wickford Dr
- 0 Medlock Bridge Rd Unit 7311679
- 4915 Millers Trace
- 3239 Claudia Ct
- 3204 Claudia Place
- 4924 Waterport Way
- 3225 Claudia Place
- 4860 Bush Rd
- 3630 Bridge Mill Ct Unit 2
- 3680 Highcroft Cir
- 4820 Coppedge Trail
- 4897 Lou Ivy Rd
- 3725 Highcroft Cir
- 5355 Spalding Bridge Ct
- 4719 Brownstone Dr
- 3905 Ancroft Cir
- 3905 Ancroft Cir Unit 11
- 5015 Felhurst Way
- 3955 Ancroft Cir
- 5025 Felhurst Way
- 3865 Ancroft Cir Unit 2B
- 3920 Ancroft Cir
- 3930 Ancroft Cir Unit 2B
- 3855 Ancroft Cir Unit 2B
- 3965 Ancroft Cir Unit 2B
- 5020 Felhurst Way Unit 2R
- 3910 Ancroft Cir
- 3940 Ancroft Cir
- 5035 Felhurst Way Unit IIB
- 3900 Ancroft Cir Unit II
- 3845 Ancroft Cir Unit 2B
- 3880 Ancroft Cir
- 3950 Ancroft Cir Unit 2B
- 5030 Felhurst Way Unit 11B
- 3890 Ancroft Cir Unit 2B