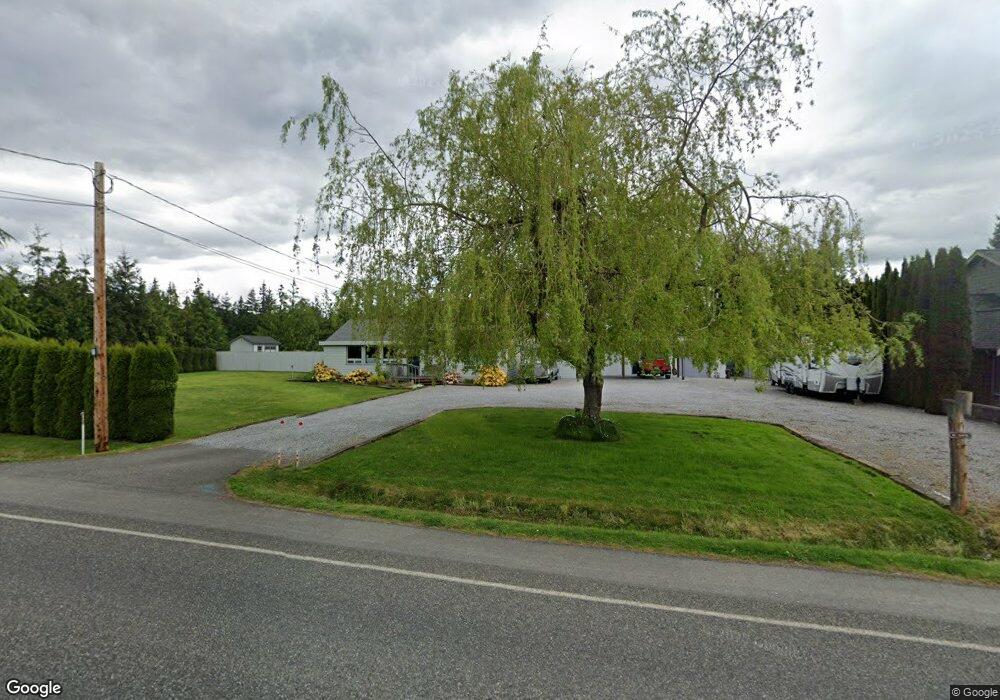
3925 Britton Rd Bellingham, WA 98226
Estimated Value: $769,000 - $841,934
4
Beds
2
Baths
2,215
Sq Ft
$364/Sq Ft
Est. Value
About This Home
This home is located at 3925 Britton Rd, Bellingham, WA 98226 and is currently estimated at $805,484, approximately $363 per square foot. 3925 Britton Rd is a home located in Whatcom County with nearby schools including Northern Heights Elementary School, Shuksan Middle School, and Squalicum High School.
Ownership History
Date
Name
Owned For
Owner Type
Purchase Details
Closed on
Oct 29, 2003
Sold by
Backman Randy L
Bought by
Davenport Stephen Todd and Davenport Kelly Shannon
Current Estimated Value
Home Financials for this Owner
Home Financials are based on the most recent Mortgage that was taken out on this home.
Original Mortgage
$143,500
Outstanding Balance
$66,250
Interest Rate
5.94%
Mortgage Type
Purchase Money Mortgage
Estimated Equity
$739,235
Purchase Details
Closed on
Apr 16, 1999
Sold by
Hollander
Bought by
Backman Randy L
Home Financials for this Owner
Home Financials are based on the most recent Mortgage that was taken out on this home.
Original Mortgage
$148,500
Interest Rate
10%
Purchase Details
Closed on
Apr 5, 1999
Sold by
Hollander
Bought by
Backman Randy L
Home Financials for this Owner
Home Financials are based on the most recent Mortgage that was taken out on this home.
Original Mortgage
$148,500
Interest Rate
10%
Create a Home Valuation Report for This Property
The Home Valuation Report is an in-depth analysis detailing your home's value as well as a comparison with similar homes in the area
Home Values in the Area
Average Home Value in this Area
Purchase History
| Date | Buyer | Sale Price | Title Company |
|---|---|---|---|
| Davenport Stephen Todd | $189,101 | Whatcom Land Title | |
| Backman Randy L | $137,528 | First American Title Ins | |
| Backman Randy L | -- | First American Title Ins |
Source: Public Records
Mortgage History
| Date | Status | Borrower | Loan Amount |
|---|---|---|---|
| Open | Davenport Stephen Todd | $143,500 | |
| Previous Owner | Backman Randy L | $148,500 | |
| Closed | Backman Randy L | $25,773 |
Source: Public Records
Tax History Compared to Growth
Tax History
| Year | Tax Paid | Tax Assessment Tax Assessment Total Assessment is a certain percentage of the fair market value that is determined by local assessors to be the total taxable value of land and additions on the property. | Land | Improvement |
|---|---|---|---|---|
| 2024 | $6,087 | $692,484 | $282,269 | $410,215 |
| 2023 | $6,087 | $722,940 | $294,683 | $428,257 |
| 2022 | $4,826 | $587,756 | $239,580 | $348,176 |
| 2021 | $4,323 | $485,749 | $198,000 | $287,749 |
| 2020 | $4,218 | $409,207 | $147,982 | $261,225 |
| 2019 | $3,755 | $382,337 | $138,368 | $243,969 |
| 2018 | $3,893 | $342,932 | $124,118 | $218,814 |
| 2017 | $3,390 | $303,428 | $109,820 | $193,608 |
| 2016 | $3,131 | $275,772 | $99,940 | $175,832 |
| 2015 | $3,307 | $262,699 | $95,000 | $167,699 |
| 2014 | -- | $269,778 | $103,200 | $166,578 |
| 2013 | -- | $258,608 | $100,000 | $158,608 |
Source: Public Records
Map
Nearby Homes
- 1430 Welling Rd
- 3871 Cindy Ln
- 1368 Roma Rd
- 3785 Greenville Place
- 1379 Northwood Ct
- 1314 Welling Rd
- 1580 Hillsdale Rd
- 4121 Malachite Dr
- 4136 Malachite Dr
- 1812 Squalicum Mountain Rd
- 1756 Emerald Lake Way
- 3827 Keystone Way
- 3606 Tree Farm Ct
- 3666 Woodlake Rd
- 3817 E Sunset Dr
- 3715 E Sunset Dr
- 1668 Sapphire Trail
- 3713 Bristol St
- 4220 Brays Way
- 3709 Bristol St
- 3937 Britton Rd
- 3946 Lakemont Rd
- 3950 Lakemont Rd
- 3945 Britton Rd
- 3942 Lakemont Rd
- 3953 Lakemont Rd
- 3922 Britton Rd
- 3951 Britton Rd
- 3938 Lakemont Rd
- 3949 Lakemont Rd
- 3926 Lakemont Rd
- 3905 Britton Rd
- 3918 Lakemont Rd
- 3945 Lakemont Rd
- 3910 Lakemont Rd
- 3959 Britton Rd
- 3904 Lakemont Rd
- 41323 BIZOP Undisclosed
- 3900 Lakemont Rd
- 6 Rocky Point Ct