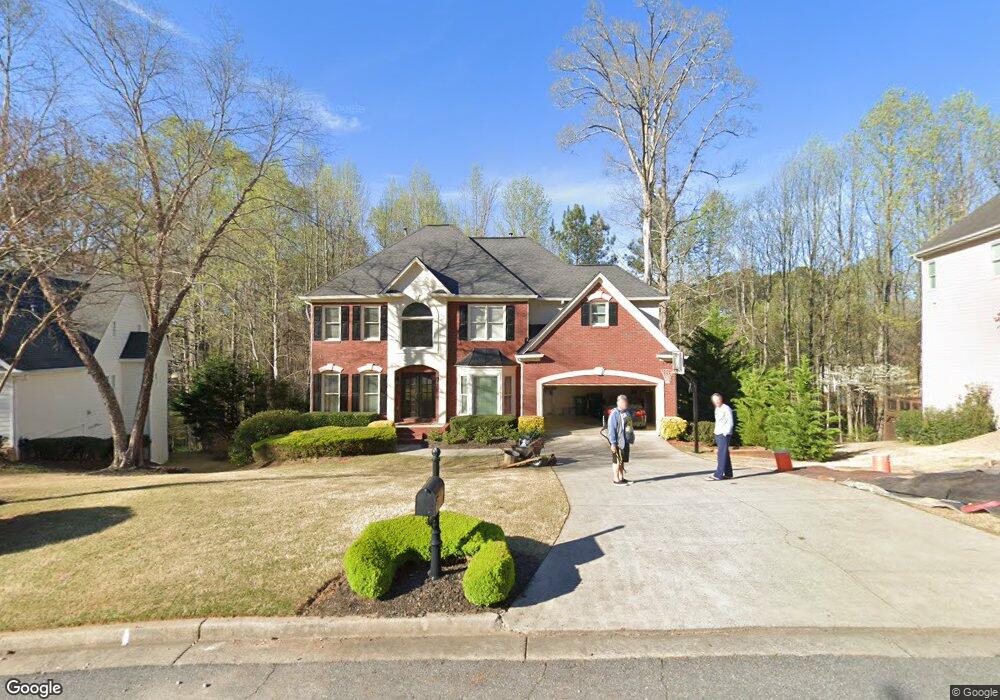
3925 Montglenn Trace Unit 3 Cumming, GA 30041
Big Creek NeighborhoodEstimated Value: $775,716 - $818,000
4
Beds
5
Baths
2,665
Sq Ft
$301/Sq Ft
Est. Value
About This Home
This home is located at 3925 Montglenn Trace Unit 3, Cumming, GA 30041 and is currently estimated at $800,929, approximately $300 per square foot. 3925 Montglenn Trace Unit 3 is a home located in Forsyth County with nearby schools including Brookwood Elementary School, South Forsyth Middle School, and Lambert High School.
Ownership History
Date
Name
Owned For
Owner Type
Purchase Details
Closed on
May 20, 2022
Sold by
Hamilton Kristina M
Bought by
Hamilton Kristina M and Hamilton Joseph
Current Estimated Value
Home Financials for this Owner
Home Financials are based on the most recent Mortgage that was taken out on this home.
Original Mortgage
$581,250
Outstanding Balance
$552,175
Interest Rate
5.25%
Estimated Equity
$248,754
Purchase Details
Closed on
Sep 12, 1997
Sold by
Odwyer & Assoc
Bought by
Mckay Keith D and Mckay Mary E
Home Financials for this Owner
Home Financials are based on the most recent Mortgage that was taken out on this home.
Original Mortgage
$204,300
Interest Rate
7.56%
Mortgage Type
New Conventional
Create a Home Valuation Report for This Property
The Home Valuation Report is an in-depth analysis detailing your home's value as well as a comparison with similar homes in the area
Home Values in the Area
Average Home Value in this Area
Purchase History
| Date | Buyer | Sale Price | Title Company |
|---|---|---|---|
| Hamilton Kristina M | -- | None Listed On Document | |
| Hamilton Kristina M | -- | None Listed On Document | |
| Mckay Keith D | $227,000 | -- |
Source: Public Records
Mortgage History
| Date | Status | Borrower | Loan Amount |
|---|---|---|---|
| Open | Hamilton Kristina M | $581,250 | |
| Closed | Hamilton Kristina M | $581,250 | |
| Previous Owner | Mckay Keith D | $204,300 |
Source: Public Records
Tax History Compared to Growth
Tax History
| Year | Tax Paid | Tax Assessment Tax Assessment Total Assessment is a certain percentage of the fair market value that is determined by local assessors to be the total taxable value of land and additions on the property. | Land | Improvement |
|---|---|---|---|---|
| 2025 | $6,143 | $294,172 | $78,000 | $216,172 |
| 2024 | $6,143 | $278,452 | $68,000 | $210,452 |
| 2023 | $5,578 | $266,008 | $60,000 | $206,008 |
| 2022 | $5,236 | $165,300 | $40,000 | $125,300 |
| 2021 | $4,565 | $165,300 | $40,000 | $125,300 |
| 2020 | $4,374 | $158,400 | $40,000 | $118,400 |
| 2019 | $4,357 | $157,540 | $40,000 | $117,540 |
| 2018 | $4,278 | $154,680 | $40,000 | $114,680 |
| 2017 | $3,626 | $130,664 | $40,000 | $90,664 |
| 2016 | $3,410 | $122,864 | $32,000 | $90,864 |
| 2015 | $3,186 | $114,584 | $28,000 | $86,584 |
| 2014 | $2,838 | $107,204 | $28,000 | $79,204 |
Source: Public Records
Map
Nearby Homes
- 3180 Caney Creek Ln
- 140 Ashewoode Downs Ln
- 3055 Rocky Brook Dr
- 5635 Ashewoode Downs Dr
- 640 Evening Pine Ln
- 680 Evening Pine Ln
- 7530 Newstead Dr
- 1250 Rosewood Dr
- 5510 Vicarage Walk
- 5650 Preserve Cir
- 5735 Sunset Maple Dr
- 5440 Vicarage Walk
- 2005 Brook Meadow Dr
- 3030 Brookwater Dr Unit 1
- 3070 Brookwater Dr
- 2875 Caney Rd
- 3915 Montglenn Trace
- 3935 Montglenn Trace Unit 3
- 3685 Evonvale Glen
- 3945 Montglenn Trace Unit 3
- 3695 Evonvale Glen
- 3905 Montglenn Trace
- 3675 Evonvale Glen
- 3930 Montglenn Trace Unit 3
- 3910 Montglenn Trace
- 3950 Montglenn Trace Unit 3
- 3910 Montvale Crossing
- 3965 Montglenn Trace
- 3690 Evonvale Glen Unit 3A
- 0 Montglenn Trace Unit 8605573
- 3655 Evonvale Glen
- 3860 Montvale Crossing Unit 1
- 3920 Montvale Crossing Unit 1
- 3905 Montvale Crossing
- 3960 Montglenn Trace Unit 3
- 3975 Montglenn Trace Unit 3