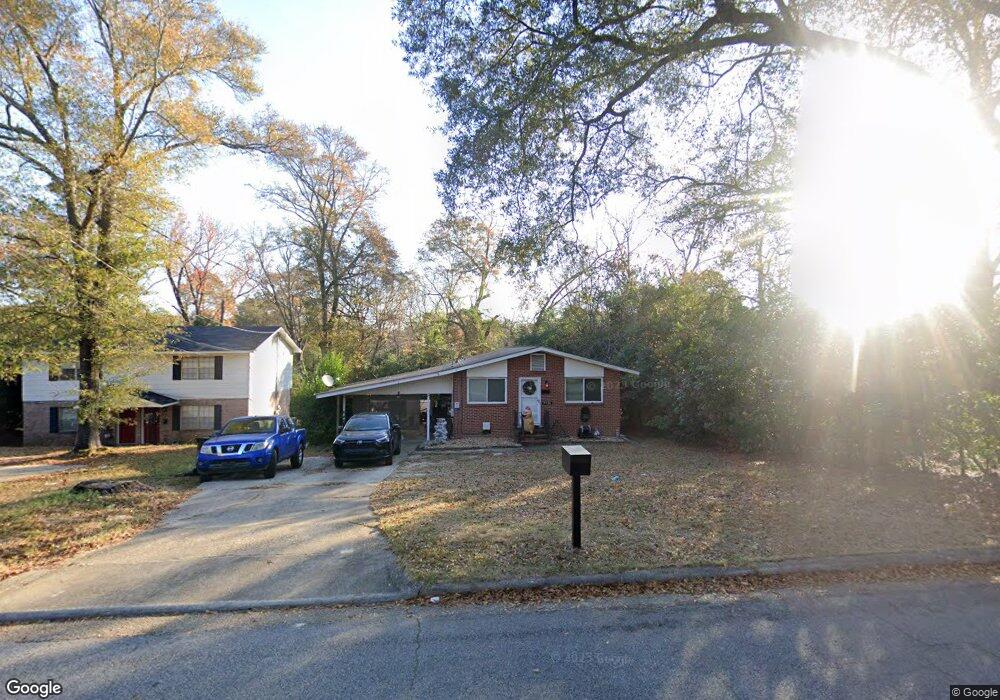
3926 14th Ave Columbus, GA 31904
Estimated Value: $141,000 - $164,000
4
Beds
3
Baths
1,000
Sq Ft
$155/Sq Ft
Est. Value
About This Home
This home is located at 3926 14th Ave, Columbus, GA 31904 and is currently estimated at $155,209, approximately $155 per square foot. 3926 14th Ave is a home located in Muscogee County with nearby schools including Johnson Elementary School, Richards Middle School, and Jordan Vocational High School.
Ownership History
Date
Name
Owned For
Owner Type
Purchase Details
Closed on
May 18, 2018
Sold by
Holder Brenda S
Bought by
Pell Eric
Current Estimated Value
Home Financials for this Owner
Home Financials are based on the most recent Mortgage that was taken out on this home.
Original Mortgage
$95,000
Outstanding Balance
$81,798
Interest Rate
4.4%
Mortgage Type
VA
Estimated Equity
$73,411
Purchase Details
Closed on
Mar 12, 2014
Sold by
Holder Brenda S
Bought by
Bedsol V Clinton
Purchase Details
Closed on
Sep 16, 2009
Sold by
G&M Kennon Properties Lllp
Bought by
Holder Brenda S
Home Financials for this Owner
Home Financials are based on the most recent Mortgage that was taken out on this home.
Original Mortgage
$95,136
Interest Rate
5.15%
Mortgage Type
FHA
Purchase Details
Closed on
Feb 5, 2008
Sold by
Johnston Michael and Meiser Tracy
Bought by
Us Bank Na Nd
Create a Home Valuation Report for This Property
The Home Valuation Report is an in-depth analysis detailing your home's value as well as a comparison with similar homes in the area
Home Values in the Area
Average Home Value in this Area
Purchase History
| Date | Buyer | Sale Price | Title Company |
|---|---|---|---|
| Pell Eric | $95,000 | -- | |
| Bedsol V Clinton | -- | -- | |
| Holder Brenda S | $110,000 | None Available | |
| Us Bank Na Nd | $54,400 | None Available |
Source: Public Records
Mortgage History
| Date | Status | Borrower | Loan Amount |
|---|---|---|---|
| Open | Pell Eric | $95,000 | |
| Previous Owner | Holder Brenda S | $95,136 |
Source: Public Records
Tax History Compared to Growth
Tax History
| Year | Tax Paid | Tax Assessment Tax Assessment Total Assessment is a certain percentage of the fair market value that is determined by local assessors to be the total taxable value of land and additions on the property. | Land | Improvement |
|---|---|---|---|---|
| 2025 | $971 | $49,160 | $7,932 | $41,228 |
| 2024 | $970 | $49,160 | $7,932 | $41,228 |
| 2023 | $282 | $49,160 | $7,932 | $41,228 |
| 2022 | $1,012 | $41,280 | $7,932 | $33,348 |
| 2021 | $1,005 | $41,272 | $7,932 | $33,340 |
| 2020 | $1,005 | $41,272 | $7,932 | $33,340 |
| 2019 | $1,010 | $38,000 | $7,400 | $30,600 |
| 2018 | $1,262 | $38,628 | $7,932 | $30,696 |
| 2017 | $1,267 | $38,628 | $7,932 | $30,696 |
| 2016 | $1,273 | $44,141 | $2,400 | $41,741 |
| 2015 | $1,276 | $44,141 | $2,400 | $41,741 |
| 2014 | $1,278 | $44,141 | $2,400 | $41,741 |
| 2013 | -- | $23,244 | $2,400 | $20,844 |
Source: Public Records
Map
Nearby Homes
- 4000 14th Ave
- 3922 14th Ave
- 4004 14th Ave
- 3916 14th Ave
- 3921 Howard Ave
- 3921 Howard Ave Unit A
- 3910 14th Ave
- 3917 Howard Ave
- 1351 40th St
- 3911 Howard Ave
- 3906 14th Ave
- 4003 Howard Ave
- 3907 Howard Ave
- 1420 41st St
- 3902 14th Ave
- 4011 Howard Ave
- 3901 Howard Ave
- 1424 41st St
- 4015 Howard Ave
- 39th 39th St