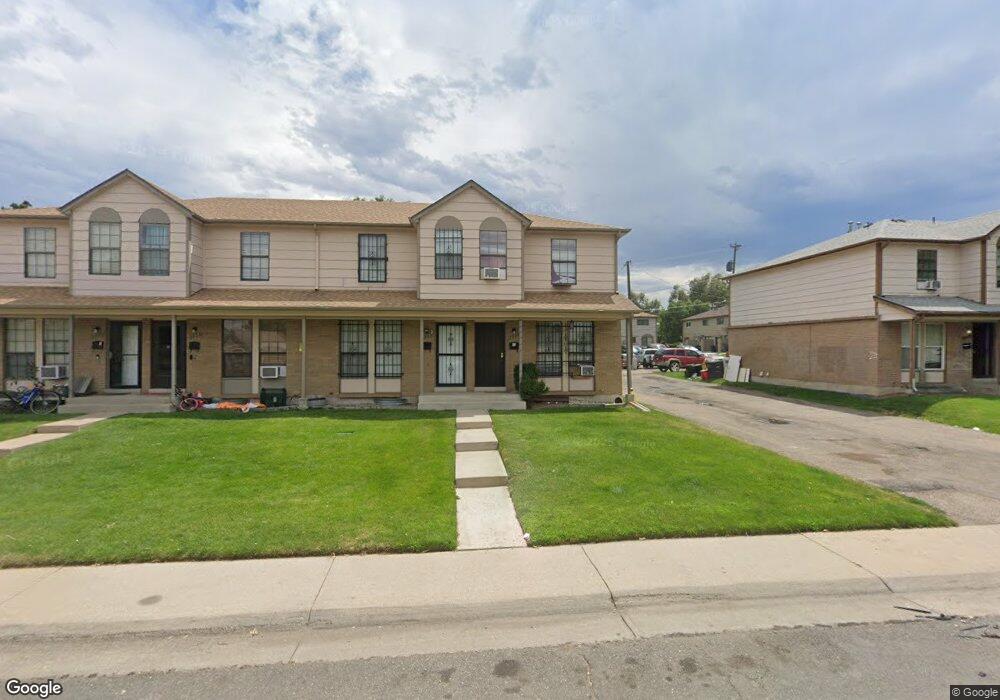
3926 W Walsh Place Unit 28 Denver, CO 80219
Westwood NeighborhoodEstimated Value: $307,480 - $356,000
2
Beds
2
Baths
1,527
Sq Ft
$218/Sq Ft
Est. Value
About This Home
This home is located at 3926 W Walsh Place Unit 28, Denver, CO 80219 and is currently estimated at $332,620, approximately $217 per square foot. 3926 W Walsh Place Unit 28 is a home located in Denver County with nearby schools including Castro Elementary School, Kepner Beacon Middle School, and West High School.
Ownership History
Date
Name
Owned For
Owner Type
Purchase Details
Closed on
Feb 13, 2017
Sold by
Thyfault Thyfault D and Thyfault David A
Bought by
Thyfault Patricia J
Current Estimated Value
Purchase Details
Closed on
Jun 1, 2011
Sold by
Vanderbilt Mortgage & Finance Inc
Bought by
Thyfault D A
Purchase Details
Closed on
Nov 18, 2010
Sold by
Lucero Ersie M
Bought by
Vanderbilt Mortgage & Finance Inc
Purchase Details
Closed on
Jul 14, 1998
Sold by
Lucero Erise M
Bought by
Lucero Ersie M
Home Financials for this Owner
Home Financials are based on the most recent Mortgage that was taken out on this home.
Original Mortgage
$61,200
Interest Rate
10.12%
Purchase Details
Closed on
May 31, 1994
Sold by
Lawrenz Pamela J
Bought by
Lucero Erise M
Home Financials for this Owner
Home Financials are based on the most recent Mortgage that was taken out on this home.
Original Mortgage
$39,950
Interest Rate
8.45%
Mortgage Type
FHA
Create a Home Valuation Report for This Property
The Home Valuation Report is an in-depth analysis detailing your home's value as well as a comparison with similar homes in the area
Home Values in the Area
Average Home Value in this Area
Purchase History
| Date | Buyer | Sale Price | Title Company |
|---|---|---|---|
| Thyfault Patricia J | -- | None Available | |
| Thyfault D A | $53,870 | Guardian Title | |
| Vanderbilt Mortgage & Finance Inc | -- | None Available | |
| Lucero Ersie M | -- | -- | |
| Lucero Erise M | $40,500 | -- |
Source: Public Records
Mortgage History
| Date | Status | Borrower | Loan Amount |
|---|---|---|---|
| Previous Owner | Lucero Ersie M | $61,200 | |
| Previous Owner | Lucero Erise M | $39,950 |
Source: Public Records
Tax History Compared to Growth
Tax History
| Year | Tax Paid | Tax Assessment Tax Assessment Total Assessment is a certain percentage of the fair market value that is determined by local assessors to be the total taxable value of land and additions on the property. | Land | Improvement |
|---|---|---|---|---|
| 2024 | $1,159 | $14,630 | $2,610 | $12,020 |
| 2023 | $1,134 | $14,630 | $2,610 | $12,020 |
| 2022 | $1,098 | $13,810 | $2,630 | $11,180 |
| 2021 | $1,060 | $14,210 | $2,710 | $11,500 |
| 2020 | $1,123 | $15,140 | $2,050 | $13,090 |
| 2019 | $1,092 | $15,140 | $2,050 | $13,090 |
| 2018 | $1,037 | $13,400 | $1,480 | $11,920 |
| 2017 | $1,034 | $13,400 | $1,480 | $11,920 |
| 2016 | $745 | $9,130 | $1,385 | $7,745 |
| 2015 | $713 | $9,130 | $1,385 | $7,745 |
| 2014 | $387 | $4,660 | $812 | $3,848 |
Source: Public Records
Map
Nearby Homes
- 3947 W Ohio Ave Unit 17
- 3703 W Walsh Place
- 655 S Perry St
- 3918 W Kentucky Ave
- 668 S Lowell Blvd
- 538 S Osceola St
- 960 S Perry St
- 656 S Stuart St
- 3503 W Ada Place
- 3570 W Center Ave
- 3470 W Walsh Place
- 671 S Stuart St
- 3520 W Center Ave
- 580 S Quitman St
- 855 S Knox Ct
- 512 S Perry St
- 549 S Raleigh St
- 1057 S Osceola St
- 461 S Lowell Blvd
- 1050 S Quitman St
- 3924 W Walsh Place Unit 27
- 3920 W Walsh Place Unit 25
- 3922 W Walsh Place Unit 26
- 3930 W Walsh Place Unit 5
- 3932 W Walsh Place Unit 6
- 3934 W Walsh Place Unit 7
- 3936 W Walsh Place Unit 8
- 3907 W Walsh Place
- 3931 W Walsh Place
- 3905 W Walsh Place
- 752 S Patton Ct Unit 2
- 754 S Patton Ct Unit 3
- 754 S Patton Ct
- 754 S Patton Ct Unit 13
- 756 S Patton Ct
- 750 S Patton Ct Unit 1
- 3919 W Walsh Place
- 3883 W Walsh Place
- 746 S Patton Ct Unit 748
- 740 S Patton Ct