3927 Clay Ct SE Dennison, OH 44621
Estimated Value: $315,000 - $408,000
3
Beds
3
Baths
2,251
Sq Ft
$163/Sq Ft
Est. Value
About This Home
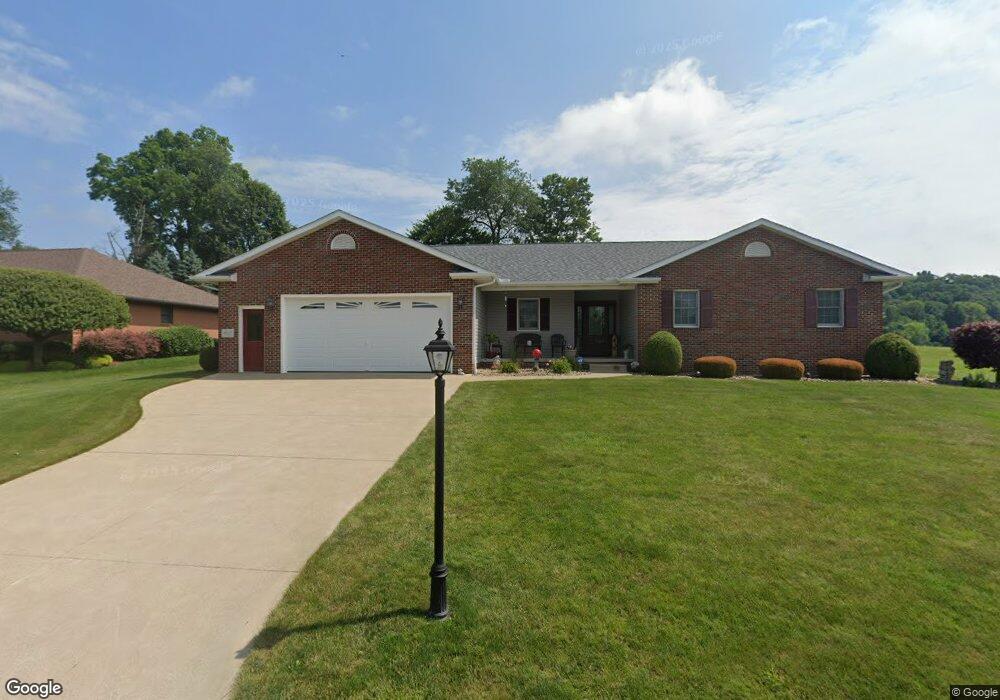
This home is located at 3927 Clay Ct SE, Dennison, OH 44621 and is currently estimated at $367,307, approximately $163 per square foot. 3927 Clay Ct SE is a home located in Tuscarawas County with nearby schools including Claymont High School and Immaculate Conception School.
Ownership History
Date
Name
Owned For
Owner Type
Purchase Details
Closed on
Aug 1, 2008
Sold by
Mears Anne Mary
Bought by
Thompson David O and Thompson Nancy A
Current Estimated Value
Home Financials for this Owner
Home Financials are based on the most recent Mortgage that was taken out on this home.
Original Mortgage
$100,000
Interest Rate
6.1%
Mortgage Type
Purchase Money Mortgage
Purchase Details
Closed on
Feb 8, 2006
Sold by
Stewart Michael and Stewart Stacey
Bought by
Mears Anne Mary
Home Financials for this Owner
Home Financials are based on the most recent Mortgage that was taken out on this home.
Original Mortgage
$242,000
Interest Rate
6.38%
Mortgage Type
Unknown
Purchase Details
Closed on
Jun 19, 2003
Sold by
Jenifer Ltd
Bought by
Stewart Michael and Stewart Stacey
Home Financials for this Owner
Home Financials are based on the most recent Mortgage that was taken out on this home.
Original Mortgage
$36,025
Interest Rate
5.71%
Mortgage Type
Purchase Money Mortgage
Create a Home Valuation Report for This Property
The Home Valuation Report is an in-depth analysis detailing your home's value as well as a comparison with similar homes in the area
Home Values in the Area
Average Home Value in this Area
Purchase History
| Date | Buyer | Sale Price | Title Company |
|---|---|---|---|
| Thompson David O | $200,000 | Attorney | |
| Mears Anne Mary | $40,500 | None Available | |
| Stewart Michael | $36,400 | -- |
Source: Public Records
Mortgage History
| Date | Status | Borrower | Loan Amount |
|---|---|---|---|
| Closed | Thompson David O | $100,000 | |
| Previous Owner | Stewart Michael | $36,025 |
Source: Public Records
Tax History Compared to Growth
Tax History
| Year | Tax Paid | Tax Assessment Tax Assessment Total Assessment is a certain percentage of the fair market value that is determined by local assessors to be the total taxable value of land and additions on the property. | Land | Improvement |
|---|---|---|---|---|
| 2024 | $3,114 | $98,110 | $10,920 | $87,190 |
| 2023 | $3,114 | $280,310 | $31,210 | $249,100 |
| 2022 | $3,206 | $98,109 | $10,924 | $87,185 |
| 2021 | $3,122 | $87,903 | $12,051 | $75,852 |
| 2020 | $3,192 | $87,903 | $12,051 | $75,852 |
| 2019 | $2,948 | $87,903 | $12,051 | $75,852 |
| 2018 | $2,720 | $78,350 | $10,740 | $67,610 |
| 2017 | $2,727 | $78,350 | $10,740 | $67,610 |
| 2016 | $2,701 | $78,350 | $10,740 | $67,610 |
| 2014 | $2,451 | $69,880 | $10,380 | $59,500 |
| 2013 | $2,456 | $69,880 | $10,380 | $59,500 |
Source: Public Records
Map
Nearby Homes
- 3264 Simpson Rd SE
- 2025 N Water Street Extension
- 4161 Indian Hill Rd SE
- 1508 Roanoke Ave
- 1221 Eastport Ave
- 1870 Midvale Mine Rd SE
- 934 Parrish St
- 0 Vernon St Unit 5009296
- 834 N Water St
- 717 N 4th St
- 523 N 1st St
- 0 Royal St
- 2993 Brightwood Rd SE
- 123 E 7th St
- 4711 Broadway
- 620 Gorley St
- 2923 Brightwood Rd SE
- 518 N Uhrich St
- 318 N 5th St
- 113 E 4th St
- 3945 Clay Ct SE
- 3911 Clay Ct SE
- 3955 Clay Ct SE
- 3897 Clay Ct SE
- 3936 Clay Ct SE
- 3912 Clay Ct SE
- 3948 Clay Ct SE
- 3898 Clay Ct SE
- 3954 Clay Ct SE
- 3883 Clay Ct SE
- 3977 Clay Ct SE
- 5914 Wolf Run Rd SE
- 3968 Clay Ct SE
- 3882 Clay Ct SE
- 5867 Rail Way SE
- 5868 Rail Way SE
- 3485 Eastport Rd SE
- 3869 Clay Ct SE
- 3431 Eastport Rd SE
- 3868 Clay Ct SE