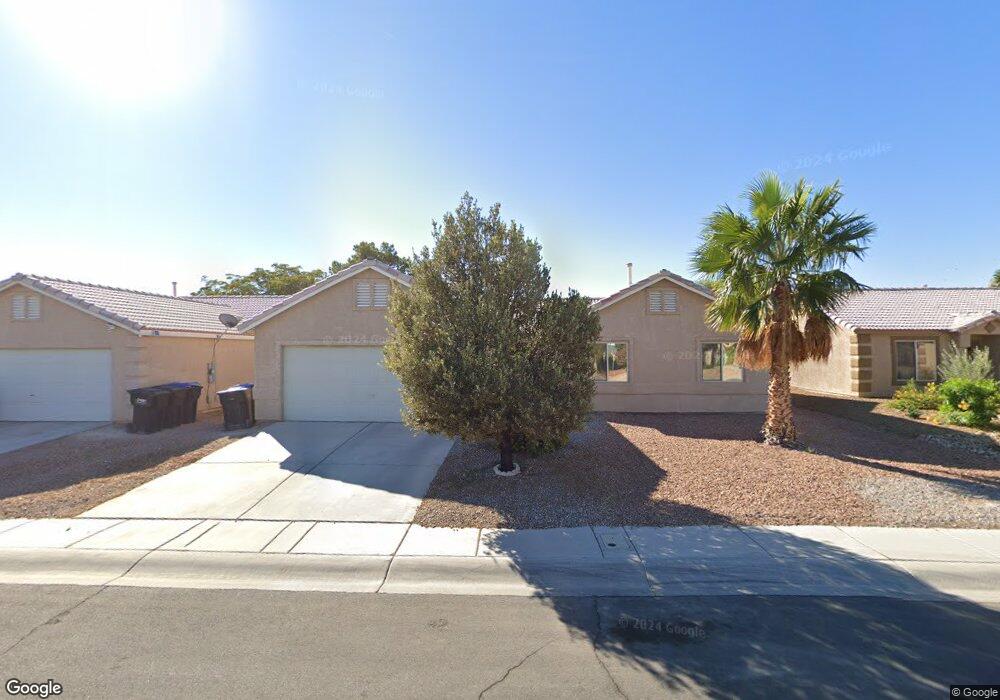
3927 Dripping Springs Ave North Las Vegas, NV 89031
Craig Ranch NeighborhoodEstimated Value: $388,620 - $418,000
3
Beds
2
Baths
1,500
Sq Ft
$267/Sq Ft
Est. Value
About This Home
This home is located at 3927 Dripping Springs Ave, North Las Vegas, NV 89031 and is currently estimated at $399,905, approximately $266 per square foot. 3927 Dripping Springs Ave is a home located in Clark County with nearby schools including Addeliar Guy Elementary School, Eva Wolfe Elementary School, and Theron L Swainston Middle School.
Ownership History
Date
Name
Owned For
Owner Type
Purchase Details
Closed on
Oct 3, 2013
Sold by
Calzacorta Carmen
Bought by
Calzacorta Carmen and The Calzacorta Family Trust
Current Estimated Value
Purchase Details
Closed on
Oct 4, 2007
Sold by
Calzacorta Carmen and Calzacorta Jose
Bought by
Calzacorta Carmen and Calzacorta Albert
Purchase Details
Closed on
Sep 12, 2001
Sold by
Calzacorta Jose and Calzacorta Carmen
Bought by
Calzacorta Carmen
Home Financials for this Owner
Home Financials are based on the most recent Mortgage that was taken out on this home.
Original Mortgage
$83,500
Outstanding Balance
$32,584
Interest Rate
7%
Estimated Equity
$367,321
Purchase Details
Closed on
Sep 6, 2001
Sold by
Mackovski Lena B
Bought by
Calzacorta Carmen
Home Financials for this Owner
Home Financials are based on the most recent Mortgage that was taken out on this home.
Original Mortgage
$83,500
Outstanding Balance
$32,584
Interest Rate
7%
Estimated Equity
$367,321
Create a Home Valuation Report for This Property
The Home Valuation Report is an in-depth analysis detailing your home's value as well as a comparison with similar homes in the area
Home Values in the Area
Average Home Value in this Area
Purchase History
| Date | Buyer | Sale Price | Title Company |
|---|---|---|---|
| Calzacorta Carmen | -- | None Available | |
| Calzacorta Carmen | -- | None Available | |
| Calzacorta Carmen | -- | Land Title | |
| Calzacorta Carmen | $128,500 | Land Title | |
| Mackovski Lena B | -- | Land Title | |
| Mackovski Lena B | -- | Land Title |
Source: Public Records
Mortgage History
| Date | Status | Borrower | Loan Amount |
|---|---|---|---|
| Open | Calzacorta Carmen | $83,500 |
Source: Public Records
Tax History Compared to Growth
Tax History
| Year | Tax Paid | Tax Assessment Tax Assessment Total Assessment is a certain percentage of the fair market value that is determined by local assessors to be the total taxable value of land and additions on the property. | Land | Improvement |
|---|---|---|---|---|
| 2025 | $1,977 | $91,682 | $33,950 | $57,732 |
| 2024 | $1,696 | $91,682 | $33,950 | $57,732 |
| 2023 | $1,129 | $78,950 | $24,500 | $54,450 |
| 2022 | $1,571 | $73,142 | $23,450 | $49,692 |
| 2021 | $1,454 | $68,651 | $21,350 | $47,301 |
| 2020 | $1,348 | $67,645 | $20,650 | $46,995 |
| 2019 | $1,263 | $64,537 | $18,200 | $46,337 |
| 2018 | $1,205 | $57,698 | $13,300 | $44,398 |
| 2017 | $1,940 | $57,830 | $12,950 | $44,880 |
| 2016 | $1,129 | $47,490 | $8,750 | $38,740 |
| 2015 | $1,126 | $38,595 | $7,000 | $31,595 |
| 2014 | $1,091 | $32,473 | $5,250 | $27,223 |
Source: Public Records
Map
Nearby Homes
- 4001 Clove Tree Ct
- 4006 Clove Tree Ct
- 4623 Reliant St
- 4537 Colonial Canyon St
- 3800 Liberator Way
- 4528 Strato Jet Way
- 3609 Cowboy Ranch Ave
- 4890 Willis St
- 4876 Lucas Creek Ct
- Denali Next Gen w/RV Plan at The Montgomery
- Leighton Next Gen w/RV Plan at The Montgomery
- Ganon Next Gen w/RV Plan at The Montgomery
- 3519 W Red Coach Ave
- 4448 Whelk Place
- 4336 Shannon Valley Ave
- 4745 Gunlock Cir
- 4319 Basil Leaf Ave
- 4636 Ferrell St
- 4508 San Mateo St
- 4013 Extenso Dr
- 3923 Dripping Springs Ave
- 4001 Dripping Springs Ave
- 3928 W Red Coach Ave
- 3924 W Red Coach Ave
- 4002 W Red Coach Ave
- 3919 Dripping Springs Ave
- 4005 Dripping Springs Ave
- 4618 Spruce Oak Dr
- 3920 W Red Coach Ave
- 4006 W Red Coach Ave
- 4002 Dripping Springs Ave
- 3915 Dripping Springs Ave
- 4009 Dripping Springs Ave
- 4006 Dripping Springs Ave
- 3916 W Red Coach Ave
- 4010 W Red Coach Ave
- 4622 Spruce Oak Dr
- 4619 Wild Oak Way
- 4010 Dripping Springs Ave
- 4001 Cotton Seed Ct