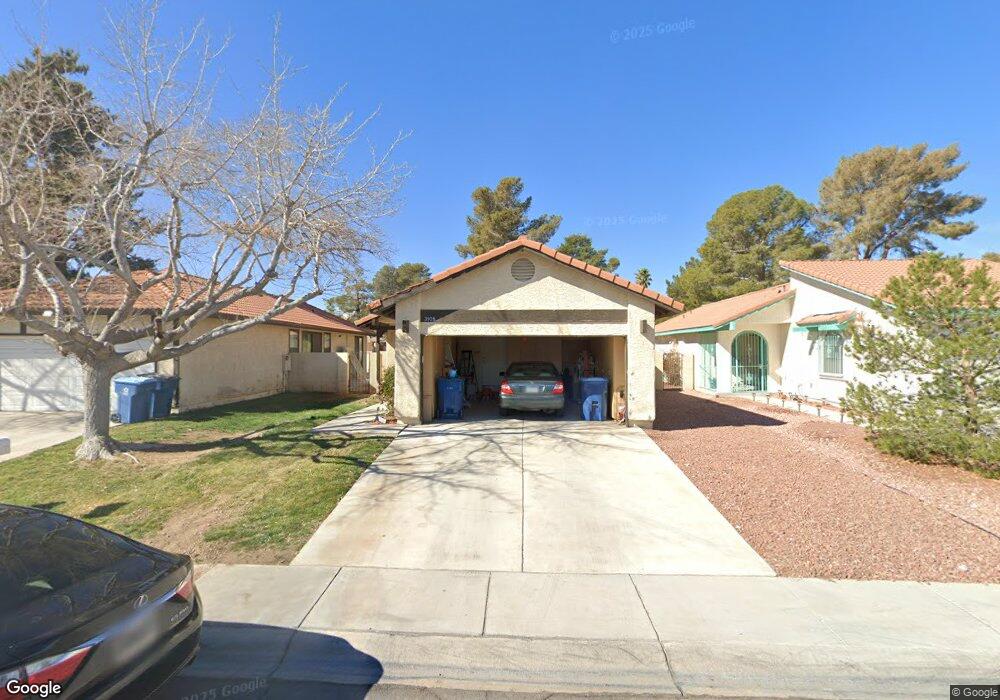
3928 Applecrest St Unit 1 Las Vegas, NV 89108
Woodcrest NeighborhoodEstimated Value: $349,651 - $379,000
3
Beds
2
Baths
1,214
Sq Ft
$297/Sq Ft
Est. Value
About This Home
This home is located at 3928 Applecrest St Unit 1, Las Vegas, NV 89108 and is currently estimated at $360,913, approximately $297 per square foot. 3928 Applecrest St Unit 1 is a home located in Clark County with nearby schools including R.E. Tobler Elementary School, Irwin & Susan Molasky Junior High School, and Cheyenne High School.
Ownership History
Date
Name
Owned For
Owner Type
Purchase Details
Closed on
Jul 20, 2001
Sold by
Graf Elsie A
Bought by
Sawyer Kathleen D
Current Estimated Value
Home Financials for this Owner
Home Financials are based on the most recent Mortgage that was taken out on this home.
Original Mortgage
$112,100
Interest Rate
6.63%
Purchase Details
Closed on
Nov 3, 1993
Sold by
Federal Commonwealth Inc
Bought by
Graf Edward and Graf Elsie A
Home Financials for this Owner
Home Financials are based on the most recent Mortgage that was taken out on this home.
Original Mortgage
$65,082
Interest Rate
6.85%
Mortgage Type
FHA
Create a Home Valuation Report for This Property
The Home Valuation Report is an in-depth analysis detailing your home's value as well as a comparison with similar homes in the area
Home Values in the Area
Average Home Value in this Area
Purchase History
| Date | Buyer | Sale Price | Title Company |
|---|---|---|---|
| Sawyer Kathleen D | $118,000 | National Title Company | |
| Graf Edward | $13,000 | Land Title |
Source: Public Records
Mortgage History
| Date | Status | Borrower | Loan Amount |
|---|---|---|---|
| Previous Owner | Sawyer Kathleen D | $112,100 | |
| Previous Owner | Graf Edward | $65,082 |
Source: Public Records
Tax History Compared to Growth
Tax History
| Year | Tax Paid | Tax Assessment Tax Assessment Total Assessment is a certain percentage of the fair market value that is determined by local assessors to be the total taxable value of land and additions on the property. | Land | Improvement |
|---|---|---|---|---|
| 2025 | $996 | $56,868 | $27,300 | $29,568 |
| 2024 | $967 | $56,868 | $27,300 | $29,568 |
| 2023 | $967 | $59,062 | $30,100 | $28,962 |
| 2022 | $939 | $50,594 | $23,800 | $26,794 |
| 2021 | $912 | $46,863 | $21,000 | $25,863 |
| 2020 | $882 | $46,322 | $20,300 | $26,022 |
| 2019 | $871 | $42,387 | $16,450 | $25,937 |
| 2018 | $832 | $39,955 | $14,700 | $25,255 |
| 2017 | $1,270 | $38,755 | $12,950 | $25,805 |
| 2016 | $780 | $35,538 | $9,100 | $26,438 |
| 2015 | $777 | $30,636 | $6,930 | $23,706 |
| 2014 | $754 | $22,320 | $5,775 | $16,545 |
Source: Public Records
Map
Nearby Homes
- 3936 Applecrest St Unit 1
- 3948 Applecrest St
- 3929 Dream St
- 6465 Plumcrest Rd
- 6553 Beacon Rd
- 6556 Gatehouse Ln
- 6604 Gatehouse Ln
- 4012 Mira Ln
- 3805 Twig Ln
- 6641 Telegraph Rd
- 6645 Telegraph Rd
- 6429 Roy Rogers Dr Unit 2
- 6609 Joe Michael Way
- 6660 Joe Michael Way
- 3757 N Torrey Pines Dr
- 3745 Colfax Cir
- 4113 Compass Rose Way
- 6440 Marrow Rd
- 4217 Jasper Ave
- 4229 Jadestone Ave
- 3932 Applecrest St
- 3924 Applecrest St
- 3924 Applecrest St
- 3940 Applecrest St Unit 1
- 3933 Applecrest St
- 3929 Applecrest St
- 3937 Applecrest St
- 3944 Applecrest St
- 3925 Applecrest St
- 3916 Applecrest St
- 6517 Pearcrest Rd
- 3921 Applecrest St
- 6513 Pearcrest Rd
- 6513 Pearcrest Rd Unit house
- 6513 Pearcrest Rd Unit SFR
- 6513 Pearcrest Rd Unit home
- 3948 Applecrest St
- 3948 Applecrest St Unit n/a
- 3912 Applecrest St
- 3909 Dream St