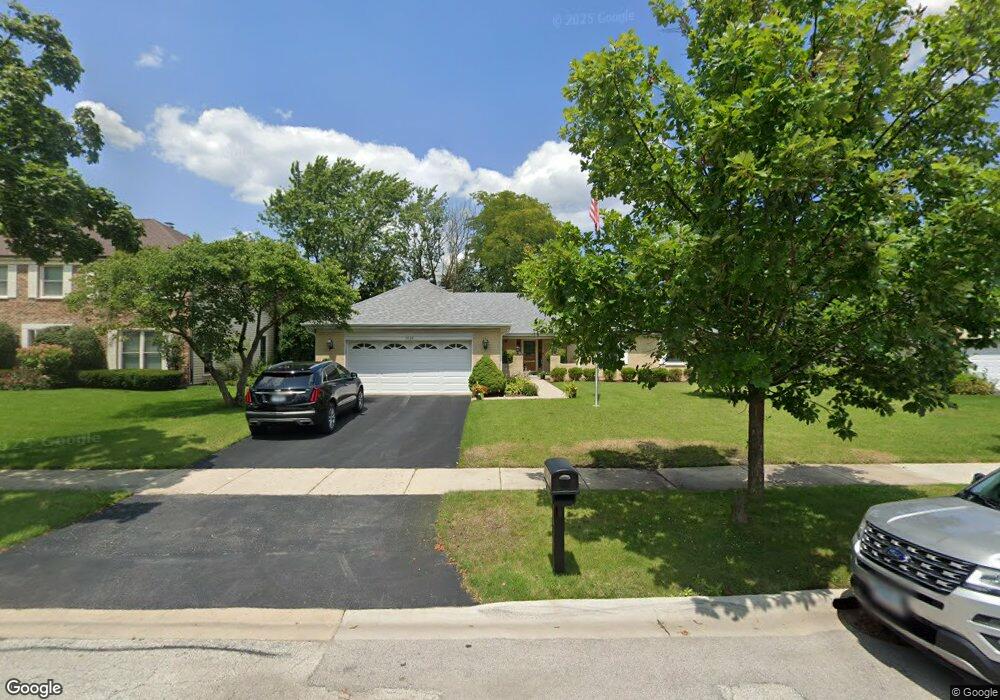
3928 Brett Ln Glenview, IL 60026
The Willows NeighborhoodEstimated Value: $718,000 - $853,000
3
Beds
2
Baths
2,318
Sq Ft
$333/Sq Ft
Est. Value
About This Home
This home is located at 3928 Brett Ln, Glenview, IL 60026 and is currently estimated at $771,483, approximately $332 per square foot. 3928 Brett Ln is a home located in Cook County with nearby schools including Henry Winkelman Elementary School, Field Middle School, and Glenbrook South High School.
Ownership History
Date
Name
Owned For
Owner Type
Purchase Details
Closed on
Sep 16, 2022
Sold by
Karakosta Jennifer C
Bought by
Mcdonough Jennifer C
Current Estimated Value
Home Financials for this Owner
Home Financials are based on the most recent Mortgage that was taken out on this home.
Original Mortgage
$480,000
Outstanding Balance
$456,992
Interest Rate
5.5%
Mortgage Type
New Conventional
Estimated Equity
$314,491
Purchase Details
Closed on
Apr 5, 2020
Sold by
Karakosta Peter W and Karakosta Jennfer C
Bought by
Karakosta Jennifer C
Home Financials for this Owner
Home Financials are based on the most recent Mortgage that was taken out on this home.
Original Mortgage
$429,000
Interest Rate
3.25%
Mortgage Type
New Conventional
Purchase Details
Closed on
Oct 11, 2017
Sold by
Karakosta Jennifer C
Bought by
Karakosta Peter W and Karakosta Jennifer C
Purchase Details
Closed on
Apr 17, 2017
Sold by
Ketter Barbara A
Bought by
Karakosta Jennifer C
Home Financials for this Owner
Home Financials are based on the most recent Mortgage that was taken out on this home.
Original Mortgage
$424,100
Interest Rate
4.62%
Mortgage Type
New Conventional
Purchase Details
Closed on
Oct 31, 2000
Sold by
Doose William L and Doose Mildred R
Bought by
Ketter Harry A and Ketter Barbara A
Create a Home Valuation Report for This Property
The Home Valuation Report is an in-depth analysis detailing your home's value as well as a comparison with similar homes in the area
Home Values in the Area
Average Home Value in this Area
Purchase History
| Date | Buyer | Sale Price | Title Company |
|---|---|---|---|
| Mcdonough Jennifer C | $30,500 | None Listed On Document | |
| Karakosta Jennifer C | -- | First American Title | |
| Karakosta Peter W | -- | First American Title | |
| Karakosta Jennifer C | $470,000 | Baird & Warner Title Service | |
| Ketter Harry A | $359,000 | -- |
Source: Public Records
Mortgage History
| Date | Status | Borrower | Loan Amount |
|---|---|---|---|
| Open | Mcdonough Jennifer C | $480,000 | |
| Previous Owner | Karakosta Jennifer C | $429,000 | |
| Previous Owner | Karakosta Jennifer C | $424,100 |
Source: Public Records
Tax History
| Year | Tax Paid | Tax Assessment Tax Assessment Total Assessment is a certain percentage of the fair market value that is determined by local assessors to be the total taxable value of land and additions on the property. | Land | Improvement |
|---|---|---|---|---|
| 2025 | $11,073 | $70,000 | $16,617 | $53,383 |
| 2024 | $11,073 | $52,833 | $14,099 | $38,734 |
| 2023 | $10,980 | $55,000 | $14,099 | $40,901 |
| 2022 | $10,980 | $55,000 | $14,099 | $40,901 |
| 2021 | $8,421 | $37,409 | $11,833 | $25,576 |
| 2020 | $8,080 | $37,409 | $11,833 | $25,576 |
| 2019 | $7,842 | $41,109 | $11,833 | $29,276 |
| 2018 | $11,677 | $51,199 | $10,322 | $40,877 |
| 2017 | $11,378 | $51,199 | $10,322 | $40,877 |
| 2016 | $9,885 | $51,199 | $10,322 | $40,877 |
| 2015 | $9,651 | $45,932 | $8,308 | $37,624 |
| 2014 | $9,399 | $45,932 | $8,308 | $37,624 |
| 2013 | $9,179 | $45,932 | $8,308 | $37,624 |
Source: Public Records
Map
Nearby Homes
- 3800 Kiess Dr
- 4142 Hampton Ct
- 3190 Landwehr Rd
- 3246 Landwehr Rd Unit 3
- 3806 Michael Ln
- 3501 Lawson Rd
- 3240 Brookdale Ln
- 2308 Indian Ridge Dr
- 1594 Portage Run
- 2745 Quail Ln
- 4408 Hammersmith Ln
- 2501 Indian Ridge Dr
- 2803 Wildflower Ct
- 3404 Salem Walk
- 3005 Highland Rd
- 3428 Salem Walk
- 1605 Elmdale Ave
- 3606 Salem Walk
- 2432 Auburn Ln
- 3456 Salem Walk
Your Personal Tour Guide
Ask me questions while you tour the home.