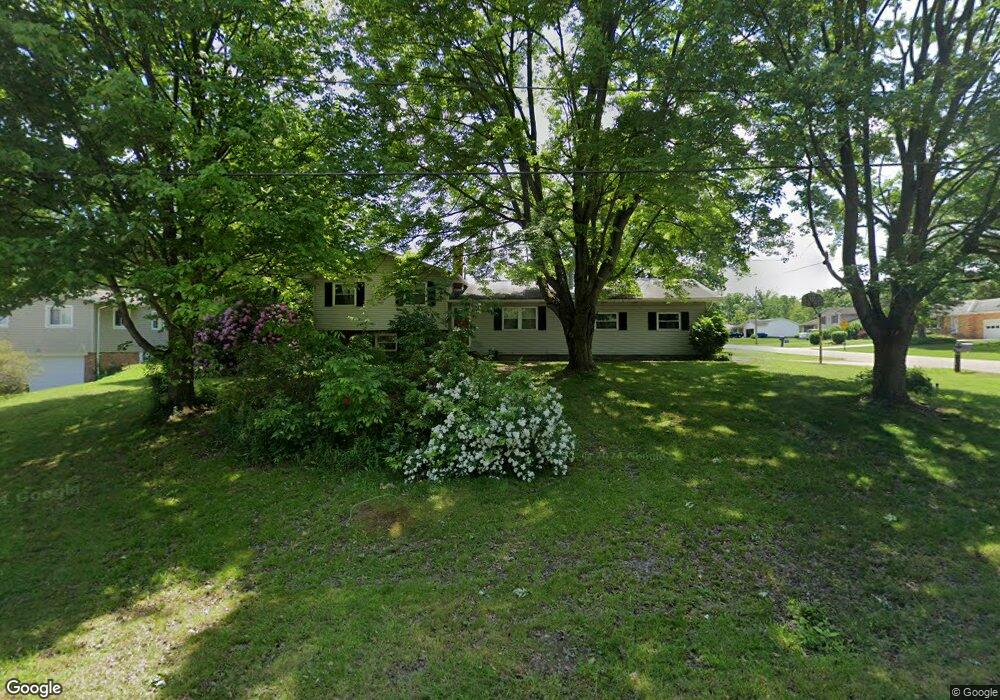
3928 Clara Ave Norton, OH 44203
Estimated Value: $217,666 - $247,000
4
Beds
2
Baths
1,300
Sq Ft
$181/Sq Ft
Est. Value
About This Home
This home is located at 3928 Clara Ave, Norton, OH 44203 and is currently estimated at $235,667, approximately $181 per square foot. 3928 Clara Ave is a home located in Summit County with nearby schools including Norton Primary Elementary School, Norton Middle School, and Norton High School.
Ownership History
Date
Name
Owned For
Owner Type
Purchase Details
Closed on
Jun 2, 2011
Sold by
Fannie Mae
Bought by
Datlenko Eric J and Datlenko Melissa D
Current Estimated Value
Home Financials for this Owner
Home Financials are based on the most recent Mortgage that was taken out on this home.
Original Mortgage
$113,059
Interest Rate
4.52%
Mortgage Type
FHA
Purchase Details
Closed on
Apr 5, 2011
Sold by
Berisford John W and Berisford Dawn M
Bought by
Federal National Mortgage Association
Home Financials for this Owner
Home Financials are based on the most recent Mortgage that was taken out on this home.
Original Mortgage
$113,059
Interest Rate
4.52%
Mortgage Type
FHA
Purchase Details
Closed on
Jan 25, 2001
Sold by
Coleman John E
Bought by
Berisford John W and Berisford Dawn M
Home Financials for this Owner
Home Financials are based on the most recent Mortgage that was taken out on this home.
Original Mortgage
$143,560
Interest Rate
7.43%
Create a Home Valuation Report for This Property
The Home Valuation Report is an in-depth analysis detailing your home's value as well as a comparison with similar homes in the area
Home Values in the Area
Average Home Value in this Area
Purchase History
| Date | Buyer | Sale Price | Title Company |
|---|---|---|---|
| Datlenko Eric J | $115,000 | Ohio Title Corp | |
| Federal National Mortgage Association | $112,000 | Attorney | |
| Berisford John W | $148,000 | First Security Title Corpora |
Source: Public Records
Mortgage History
| Date | Status | Borrower | Loan Amount |
|---|---|---|---|
| Previous Owner | Datlenko Eric J | $113,059 | |
| Previous Owner | Berisford John W | $143,560 |
Source: Public Records
Tax History Compared to Growth
Tax History
| Year | Tax Paid | Tax Assessment Tax Assessment Total Assessment is a certain percentage of the fair market value that is determined by local assessors to be the total taxable value of land and additions on the property. | Land | Improvement |
|---|---|---|---|---|
| 2025 | $3,510 | $57,701 | $15,309 | $42,392 |
| 2024 | $2,362 | $57,701 | $15,309 | $42,392 |
| 2023 | $3,510 | $57,701 | $15,309 | $42,392 |
| 2022 | $2,012 | $40,352 | $10,707 | $29,645 |
| 2021 | $2,022 | $40,352 | $10,707 | $29,645 |
| 2020 | $1,888 | $40,360 | $10,710 | $29,650 |
| 2019 | $2,454 | $46,080 | $12,410 | $33,670 |
| 2018 | $2,450 | $46,080 | $12,410 | $33,670 |
| 2017 | $2,922 | $46,080 | $12,410 | $33,670 |
| 2016 | $2,922 | $51,130 | $13,720 | $37,410 |
| 2015 | $2,922 | $51,130 | $13,720 | $37,410 |
| 2014 | $2,895 | $51,130 | $13,720 | $37,410 |
| 2013 | $2,864 | $51,130 | $13,720 | $37,410 |
Source: Public Records
Map
Nearby Homes
- S/L 179 Belt Line Dr
- 2 V/L S Medina Line Rd
- 1 V/L S Medina Line Rd
- 3720 Strawboard Ave
- Deer Valley Plan at The Reserve at Sharon
- Skyview Plan at The Reserve at Sharon
- Bourges Plan at The Reserve at Sharon
- Lyon Plan at The Reserve at Sharon
- Woodside Plan at The Reserve at Sharon
- Allison II Plan at The Reserve at Sharon
- Willwood Plan at The Reserve at Sharon
- 0 Reimer Rd Unit 3968822
- Grand Cayman Plan at Brookside Greens - Ranches
- Eden Cay Plan at Brookside Greens - Ranches
- Aruba Bay Plan at Brookside Greens - Ranches
- Grand Bahama Plan at Brookside Greens - Ranches
- 3738 Kirkham Dr
- 3923 Higgins Dr
- Birch w/ Basement Plan at Brookside Greens - 2-Story
- Hazel w/ Basement Plan at Brookside Greens - 2-Story
- 3918 Clara Ave
- 3908 Clara Ave
- 3216 Greenbrier Dr
- 3197 Greenbrier Dr
- 3226 Greenbrier Dr
- 3235 Greenbrier Dr
- 3950 Holiday Dr
- 3915 Jean Ln
- 3236 Greenbrier Dr
- 3898 Clara Ave
- 3948 Holiday Dr
- 3909 Clara Ave
- 3246 Greenbrier Dr
- 3905 Jean Ln
- 3899 Clara Ave
- 3970 Holiday Dr
- 99999 Holiday Dr
- 3934 Jean Ln
- 3256 Greenbrier Dr
- 3924 Jean Ln