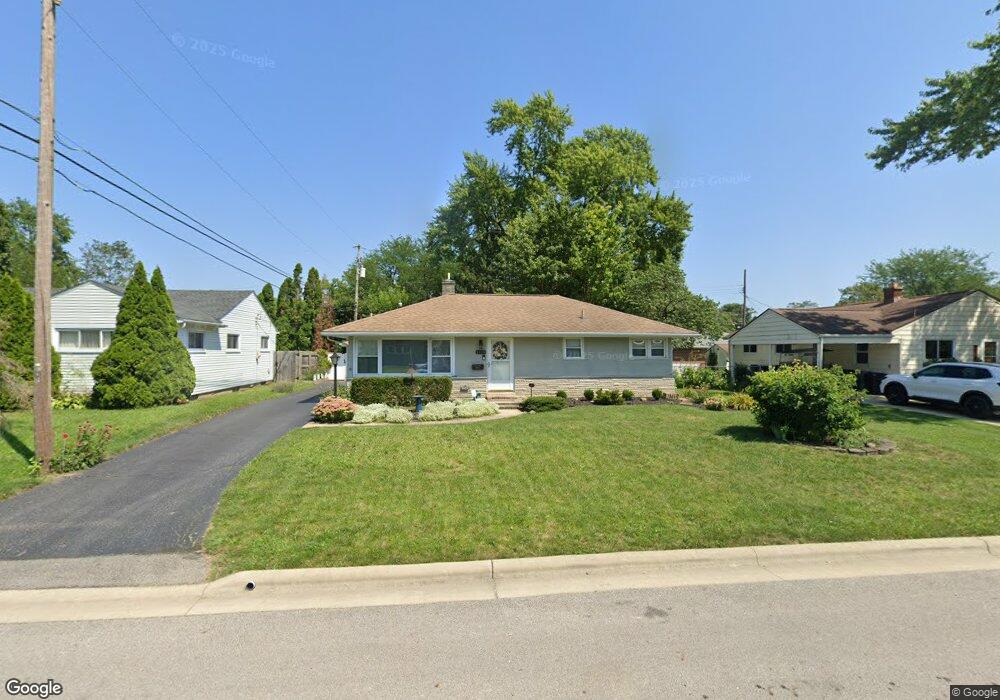
3928 Girbert St Grove City, OH 43123
Estimated Value: $239,128 - $269,000
3
Beds
1
Bath
960
Sq Ft
$264/Sq Ft
Est. Value
About This Home
This home is located at 3928 Girbert St, Grove City, OH 43123 and is currently estimated at $253,032, approximately $263 per square foot. 3928 Girbert St is a home located in Franklin County with nearby schools including Park Street Intermediate School, Richard Avenue Elementary School, and Grove City High School.
Ownership History
Date
Name
Owned For
Owner Type
Purchase Details
Closed on
Jan 12, 2012
Sold by
Sealock Sharon K and The Sharon K Sealock Keystone
Bought by
Strawser Beth Ann and The Sharon Sealock Keystone In
Current Estimated Value
Purchase Details
Closed on
Jun 18, 1999
Sold by
Sealock Sharon K
Bought by
Sealock Sharon K and The Sealock Family Trust
Purchase Details
Closed on
Sep 24, 1992
Bought by
Sealock Sharon K
Purchase Details
Closed on
Aug 1, 1978
Create a Home Valuation Report for This Property
The Home Valuation Report is an in-depth analysis detailing your home's value as well as a comparison with similar homes in the area
Home Values in the Area
Average Home Value in this Area
Purchase History
| Date | Buyer | Sale Price | Title Company |
|---|---|---|---|
| Strawser Beth Ann | -- | Attorney | |
| Sealock Sharon K | -- | None Available | |
| Sealock Sharon K | -- | -- | |
| Sealock Sharon K | $77,000 | -- | |
| -- | $46,200 | -- |
Source: Public Records
Tax History Compared to Growth
Tax History
| Year | Tax Paid | Tax Assessment Tax Assessment Total Assessment is a certain percentage of the fair market value that is determined by local assessors to be the total taxable value of land and additions on the property. | Land | Improvement |
|---|---|---|---|---|
| 2024 | $2,784 | $71,020 | $24,150 | $46,870 |
| 2023 | $2,773 | $71,015 | $24,150 | $46,865 |
| 2022 | $2,352 | $47,320 | $9,590 | $37,730 |
| 2021 | $2,398 | $47,320 | $9,590 | $37,730 |
| 2020 | $2,390 | $47,320 | $9,590 | $37,730 |
| 2019 | $2,081 | $39,910 | $8,020 | $31,890 |
| 2018 | $1,037 | $39,910 | $8,020 | $31,890 |
| 2017 | $2,066 | $39,910 | $8,020 | $31,890 |
| 2016 | $1,966 | $35,880 | $8,650 | $27,230 |
| 2015 | $983 | $35,880 | $8,650 | $27,230 |
| 2014 | $1,968 | $35,880 | $8,650 | $27,230 |
| 2013 | $929 | $35,875 | $8,645 | $27,230 |
Source: Public Records
Map
Nearby Homes
- 3944 Girbert St
- 3163 Gunderman Ave
- 3933 Glenna Ave
- 3084 Sawyer Dr
- 3687 Homecomer Dr
- 4370 Pummelo Dr
- 4357 Pummelo Dr
- 4256 Eleanor Ave
- 3910 Security Dr
- 4241 Ashgrove Dr
- 3283 Kingston Ave
- 4277 Beechgrove Dr
- 4284 Beechgrove Dr
- 4236 Maplegrove Dr
- 3534 Beulah Way
- 3660 Brinkman Dr
- 3405 Woodlawn Ave
- 3575 Grant Ave
- 4318 Maplegrove Dr
- 4159 Franklin St
- 3936 Girbert St
- 3922 Girbert St
- 3073 Gunderman Ave
- 3931 Girbert St
- 3070 Lotz Dr Unit 74
- 3939 Girbert St
- 3923 Girbert St
- 3945 Girbert St
- 3074 Gunderman Ave
- 3900 Girbert St
- 3909 Girbert St
- 3055 Wendy Ln
- 3054 Lotz Dr
- 3097 Lotz Dr
- 3089 Lotz Dr
- 3107 Lotz Dr
- 3938 Orchard Ln
- 3922 Orchard Ln
- 3081 Lotz Dr
- 3892 Girbert St