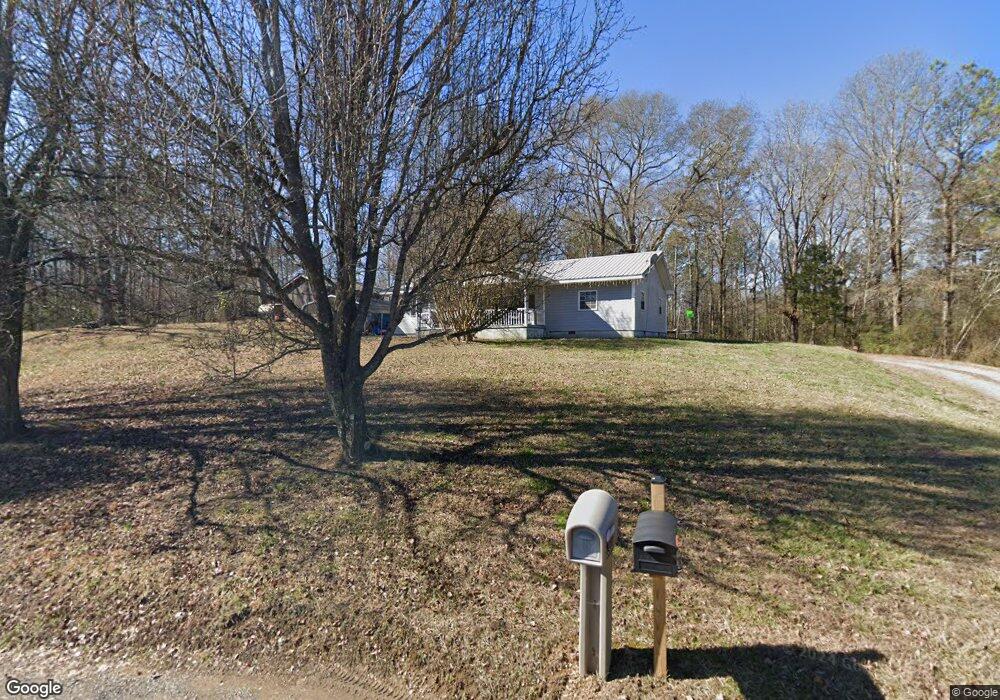
3928 Hayesport Dr SE Dalton, GA 30721
Estimated Value: $178,000 - $207,183
--
Bed
1
Bath
1,344
Sq Ft
$143/Sq Ft
Est. Value
About This Home
This home is located at 3928 Hayesport Dr SE, Dalton, GA 30721 and is currently estimated at $192,296, approximately $143 per square foot. 3928 Hayesport Dr SE is a home located in Whitfield County with nearby schools including Valley Point Elementary School, Valley Point Middle School, and Southeast Whitfield County High School.
Ownership History
Date
Name
Owned For
Owner Type
Purchase Details
Closed on
Feb 24, 2023
Sold by
Truesouth House Buyers Ga Llc
Bought by
Duckett John T
Current Estimated Value
Purchase Details
Closed on
Feb 3, 2009
Sold by
Wachovia Mtg Corp
Bought by
Federal National Mtg Associati
Purchase Details
Closed on
Oct 26, 2007
Sold by
Pittman Olin
Bought by
Pittman David E
Home Financials for this Owner
Home Financials are based on the most recent Mortgage that was taken out on this home.
Original Mortgage
$152,000
Interest Rate
6.37%
Mortgage Type
New Conventional
Purchase Details
Closed on
Dec 15, 2005
Sold by
Not Provided
Bought by
Smith James Randall
Purchase Details
Closed on
Nov 19, 2001
Sold by
Pittman Cordie Sue Brock and Brock James
Bought by
Pittman Cordie Sue Brock
Create a Home Valuation Report for This Property
The Home Valuation Report is an in-depth analysis detailing your home's value as well as a comparison with similar homes in the area
Home Values in the Area
Average Home Value in this Area
Purchase History
| Date | Buyer | Sale Price | Title Company |
|---|---|---|---|
| Duckett John T | $180,000 | -- | |
| Federal National Mtg Associati | $70,000 | -- | |
| Pittman David E | $152,000 | -- | |
| Smith James Randall | -- | -- | |
| Pittman Cordie Sue Brock | -- | -- |
Source: Public Records
Mortgage History
| Date | Status | Borrower | Loan Amount |
|---|---|---|---|
| Previous Owner | Pittman David E | $152,000 |
Source: Public Records
Tax History Compared to Growth
Tax History
| Year | Tax Paid | Tax Assessment Tax Assessment Total Assessment is a certain percentage of the fair market value that is determined by local assessors to be the total taxable value of land and additions on the property. | Land | Improvement |
|---|---|---|---|---|
| 2024 | $1,086 | $61,389 | $4,429 | $56,960 |
| 2023 | $1,086 | $43,198 | $3,378 | $39,820 |
| 2022 | $607 | $29,142 | $2,966 | $26,176 |
| 2021 | $607 | $29,142 | $2,966 | $26,176 |
| 2020 | $617 | $29,142 | $2,966 | $26,176 |
| 2019 | $621 | $29,142 | $2,966 | $26,176 |
| 2018 | $611 | $28,678 | $2,502 | $26,176 |
| 2017 | $611 | $28,678 | $2,502 | $26,176 |
| 2016 | $533 | $26,438 | $2,502 | $23,936 |
| 2014 | $480 | $25,228 | $2,497 | $22,732 |
| 2013 | -- | $25,228 | $2,496 | $22,731 |
Source: Public Records
Map
Nearby Homes
- 4280 Old Dixie Hwy SE
- 207 Carol Joyce Dr SE
- 213 Gwendolyn Lee Ln
- 200 Carol Joyce Dr SE
- 4381 S Dixie Hwy
- 4486 S Dixie Hwy
- 2727 Old Tilton Rd SE
- 147 Toria Trace
- 0 Carbondale Rd SW Unit 130445
- 0 Carbondale Rd SW Unit 10515867
- 0 Carbondale Rd SW Unit 7574085
- 0 Carbondale Rd SW Unit 129966
- 0 Carbondale Rd SW Unit 129726
- 450 Collington Cir
- 9 River Oaks Dr
- 586 Collington Cir
- 243 Gaz Rd SE
- 286 River Oaks Dr
- 122 Fairmont Way
- 140 Praters Dr
- 3928 Hayesport Dr SE
- 3920 Hayesport Dr SE
- 3920 Hayesport Dr SE
- 3916 Hayesport Dr SE
- 3932 Hayesport Dr SE
- 3940 Hayesport Dr SE
- 658 Tilton Rd SE
- 151 Beaverpelt Way
- 3981 Hayesport Dr SE
- 576 Tilton Rd SE
- 645 Tilton Rd SE
- 664 Tilton Rd SE
- 657 Tilton Rd SE
- 3980 Hayesport Dr SE
- 572 Tilton Rd SE
- 3983 Hayesport Dr SE
- 607 Tilton Rd SE
- 573 Tilton Rd SE
- 573 Tilton Rd SE
- 535 Tilton Rd SE