Estimated Value: $229,000 - $383,000
4
Beds
2
Baths
1,628
Sq Ft
$179/Sq Ft
Est. Value
About This Home
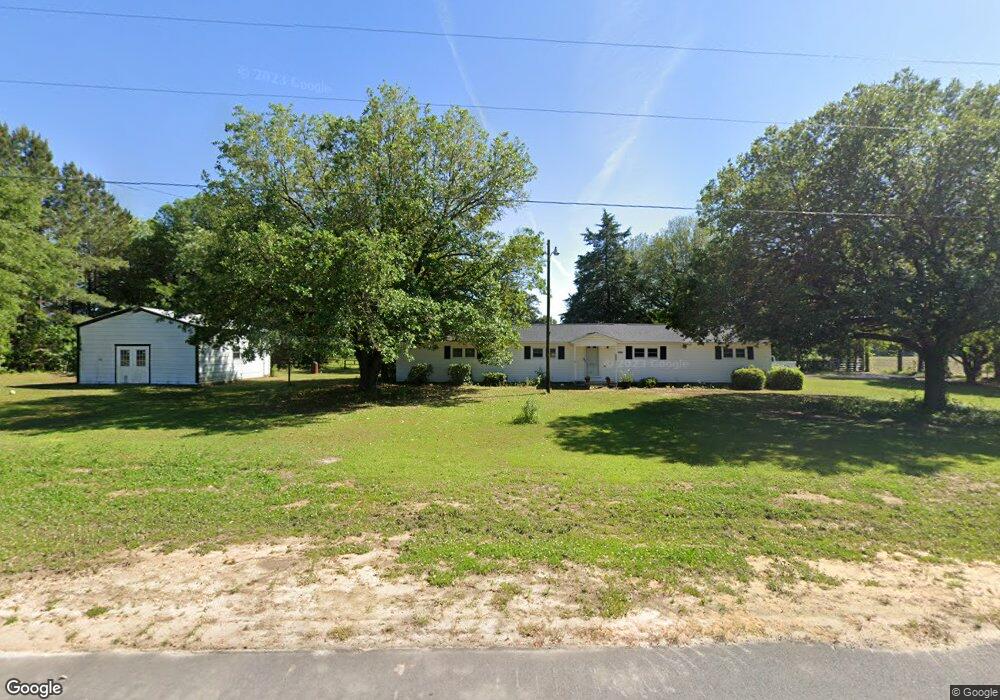
This home is located at 3928 Vick Rd, Aynor, SC 29511 and is currently estimated at $291,899, approximately $179 per square foot. 3928 Vick Rd is a home located in Horry County with nearby schools including Midland Elementary School, Aynor Middle School, and Aynor High School.
Ownership History
Date
Name
Owned For
Owner Type
Purchase Details
Closed on
Feb 26, 2007
Sold by
Swett Robert T
Bought by
Altman Shannon M
Current Estimated Value
Purchase Details
Closed on
Sep 1, 2005
Sold by
Rabon Larry C and Rabon Shirley J
Bought by
Swett Robert T and Altman Shannon M
Home Financials for this Owner
Home Financials are based on the most recent Mortgage that was taken out on this home.
Original Mortgage
$147,250
Interest Rate
6.87%
Mortgage Type
Fannie Mae Freddie Mac
Purchase Details
Closed on
Feb 8, 2005
Sold by
Va
Bought by
Rabon Larry C and Rabon Shirley J
Purchase Details
Closed on
Mar 8, 2004
Sold by
Sherman Johnathan L and Cendant Mortgage Corp
Bought by
Va
Purchase Details
Closed on
Nov 27, 2000
Sold by
Morrissey Lois J
Bought by
Sherman Johnathan L
Home Financials for this Owner
Home Financials are based on the most recent Mortgage that was taken out on this home.
Original Mortgage
$112,200
Interest Rate
7.71%
Mortgage Type
VA
Create a Home Valuation Report for This Property
The Home Valuation Report is an in-depth analysis detailing your home's value as well as a comparison with similar homes in the area
Home Values in the Area
Average Home Value in this Area
Purchase History
| Date | Buyer | Sale Price | Title Company |
|---|---|---|---|
| Altman Shannon M | $142,000 | None Available | |
| Swett Robert T | $155,000 | -- | |
| Rabon Larry C | $110,000 | -- | |
| Va | $10,000 | -- | |
| Sherman Johnathan L | $110,000 | -- |
Source: Public Records
Mortgage History
| Date | Status | Borrower | Loan Amount |
|---|---|---|---|
| Previous Owner | Swett Robert T | $147,250 | |
| Previous Owner | Sherman Johnathan L | $112,200 |
Source: Public Records
Tax History Compared to Growth
Tax History
| Year | Tax Paid | Tax Assessment Tax Assessment Total Assessment is a certain percentage of the fair market value that is determined by local assessors to be the total taxable value of land and additions on the property. | Land | Improvement |
|---|---|---|---|---|
| 2024 | $335 | $8,865 | $6,096 | $2,769 |
| 2023 | $335 | $5,259 | $3,014 | $2,245 |
| 2021 | $305 | $6,839 | $3,807 | $3,032 |
| 2020 | $298 | $6,839 | $3,807 | $3,032 |
| 2019 | $298 | $6,839 | $3,807 | $3,032 |
| 2018 | $0 | $4,580 | $2,628 | $1,952 |
| 2017 | $258 | $4,580 | $2,628 | $1,952 |
| 2016 | -- | $4,580 | $2,628 | $1,952 |
| 2015 | $258 | $4,580 | $2,628 | $1,952 |
| 2014 | $240 | $4,580 | $2,628 | $1,952 |
Source: Public Records
Map
Nearby Homes
- 3883 Goff Rd
- 4082 Edwards Rd
- TBD Long Bay Rd
- 201 Kc Ln
- 217 Kc Ln
- 209 Kc Ln
- 205 Kc Ln
- 2494 Newton Rd
- TBD Joyner Swamp Rd
- TBD Joyner Swamp Rd Unit Lot 3
- TBD Joyner Swamp Rd Unit Lot 6
- TBD Joyner Swamp Rd Unit Lot 8
- TBD Joyner Swamp Rd Unit Lot 7
- TBD Joyner Swamp Rd Unit Lot 10A
- TBD Joyner Swamp Rd Unit Lot 9A
- TBD Joyner Swamp Rd Unit Lot 8A
- TBD Joyner Swamp Rd Unit Lot 7A
- TBD Joyner Swamp Rd Unit Lot 6A
- TBD Joyner Swamp Rd Unit Lot 5A
- TBD Joyner Swamp Rd Unit Lot 4A
- 3936 Vick Rd
- 3944 Vick Rd
- 4000 Vick Rd
- 3771 Edwards Rd Unit 3B - Cedar
- 3810 Edwards Rd
- 3777 Edwards Rd Unit 3C - Live Oak
- 3765 Edwards Rd
- 3765 Edwards Rd Unit Lot 3A - Tupelo
- 3753 Edwards Rd Unit 2B - Cedar
- South Vick Rd
- 3759 Edwards Rd Unit 2C - Live Oak
- Lot 3 Vick Rd
- Lot 2 Vick Rd
- 3747 Edwards Rd Unit 2A - Live Oak
- 3747 Edwards Rd Unit 2A - Dogwood 4
- 3741 Edwards Rd Unit 1B - Dogwood 4
- 3741 Edwards Rd Unit 1B - Tupelo
- 3735 Edwards Rd Unit Lot 1A
- 3872 Goff Rd
- 3860 Goff Rd