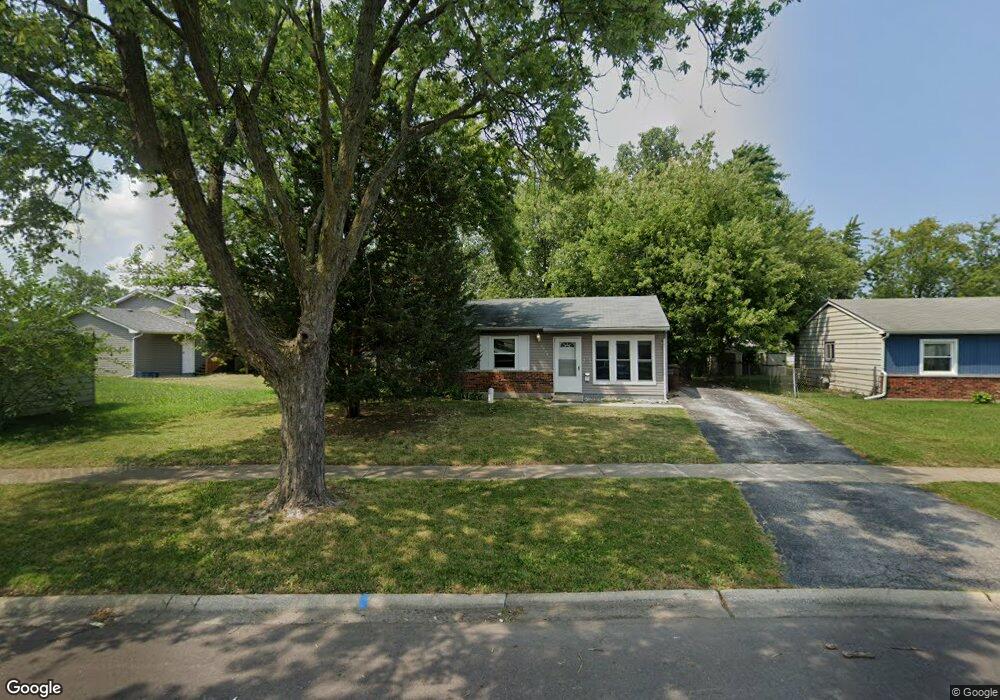
3929 171st Place Unit HOUSE Country Club Hills, IL 60478
Estimated Value: $153,000 - $219,000
4
Beds
1
Bath
1,034
Sq Ft
$176/Sq Ft
Est. Value
About This Home
This home is located at 3929 171st Place Unit HOUSE, Country Club Hills, IL 60478 and is currently estimated at $182,110, approximately $176 per square foot. 3929 171st Place Unit HOUSE is a home located in Cook County with nearby schools including Highlands Elementary School, Prairie-Hills Junior High School, and Hillcrest High School.
Ownership History
Date
Name
Owned For
Owner Type
Purchase Details
Closed on
Feb 5, 2016
Sold by
Jca Fund 11 Llc
Bought by
Cga Chicago Llc
Current Estimated Value
Purchase Details
Closed on
Apr 30, 2015
Sold by
Lakeside Capital Assets Llc
Bought by
Jca Fund 11 Llc Series 3929
Purchase Details
Closed on
Nov 20, 2014
Sold by
County Of Cook
Bought by
Lakeside Capital Assets Llc
Purchase Details
Closed on
Aug 18, 2005
Sold by
Christ Robert
Bought by
Smith Danaun L
Home Financials for this Owner
Home Financials are based on the most recent Mortgage that was taken out on this home.
Original Mortgage
$80,000
Interest Rate
6.25%
Mortgage Type
Purchase Money Mortgage
Purchase Details
Closed on
Sep 13, 2004
Sold by
Christ Robert and Christ Mary
Bought by
Christ Robert
Create a Home Valuation Report for This Property
The Home Valuation Report is an in-depth analysis detailing your home's value as well as a comparison with similar homes in the area
Home Values in the Area
Average Home Value in this Area
Purchase History
| Date | Buyer | Sale Price | Title Company |
|---|---|---|---|
| Cga Chicago Llc | -- | Greater Illinois Title | |
| Jca Fund 11 Llc Series 3929 | $30,000 | First American | |
| Lakeside Capital Assets Llc | -- | None Available | |
| Smith Danaun L | $100,000 | Cti | |
| Christ Robert | -- | -- |
Source: Public Records
Mortgage History
| Date | Status | Borrower | Loan Amount |
|---|---|---|---|
| Previous Owner | Smith Danaun L | $80,000 |
Source: Public Records
Tax History Compared to Growth
Tax History
| Year | Tax Paid | Tax Assessment Tax Assessment Total Assessment is a certain percentage of the fair market value that is determined by local assessors to be the total taxable value of land and additions on the property. | Land | Improvement |
|---|---|---|---|---|
| 2024 | $6,303 | $11,661 | $2,778 | $8,883 |
| 2023 | $5,793 | $12,000 | $2,778 | $9,222 |
| 2022 | $5,793 | $7,810 | $2,381 | $5,429 |
| 2021 | $5,688 | $7,809 | $2,381 | $5,428 |
| 2020 | $5,508 | $7,809 | $2,381 | $5,428 |
| 2019 | $2,490 | $6,897 | $2,182 | $4,715 |
| 2018 | $3,624 | $8,676 | $2,182 | $6,494 |
| 2017 | $3,524 | $8,676 | $2,182 | $6,494 |
| 2016 | $3,166 | $7,144 | $1,984 | $5,160 |
| 2015 | $3,530 | $8,012 | $1,984 | $6,028 |
| 2014 | $3,515 | $8,012 | $1,984 | $6,028 |
| 2013 | -- | $7,944 | $1,984 | $5,960 |
Source: Public Records
Map
Nearby Homes
- 17126 Orchard Ln
- 3881 171st St
- 3800 171st St
- 3806 172nd St
- 16948 Glen Oaks Dr
- 16928 Old Elm Dr
- 16920 Glen Oaks Dr
- 3618 Peach Grove Ln
- 3907 168th Place
- 17303 Appletree Dr
- 16843 Briargate Dr
- 4101 Park Ln Unit 1
- 17004 Locust Dr
- 3949 168th St
- 3831 168th St
- 17511 Winston Dr Unit 1
- 3512 Woodworth Place
- 17316 Central Park Ave
- 3718 168th St
- 3801 167th Place
- 3929 171st Place
- 3929 171st Place Unit 1
- 3921 171st Place
- 3930 171st St
- 3911 171st Place
- 17142 Orchard Ln
- 3920 171st St
- 17116 Orchard Ln
- 3910 171st St
- 3903 171st Place
- 3930 171st Place
- 3910 171st Place
- 3891 171st Place
- 3892 171st St
- 3914 Timberlea Ct
- 3950 171st Place
- 3931 171st St
- 3943 171st St
- 3923 171st St