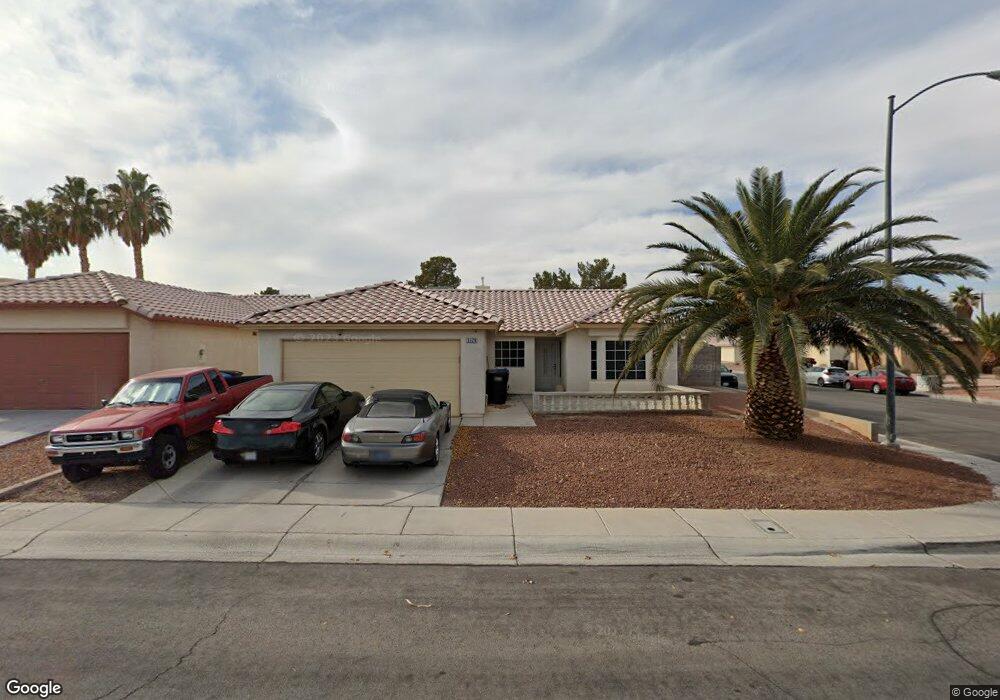
3929 Cheryl Clay Way North Las Vegas, NV 89032
Cheyenne NeighborhoodEstimated Value: $370,000 - $389,000
3
Beds
2
Baths
1,328
Sq Ft
$285/Sq Ft
Est. Value
About This Home
This home is located at 3929 Cheryl Clay Way, North Las Vegas, NV 89032 and is currently estimated at $378,477, approximately $284 per square foot. 3929 Cheryl Clay Way is a home located in Clark County with nearby schools including Lucile Bruner Elementary School, Theron L Swainston Middle School, and Cheyenne High School.
Ownership History
Date
Name
Owned For
Owner Type
Purchase Details
Closed on
Aug 6, 2021
Sold by
Young Elaine and Black Shaun
Bought by
Black Shaun
Current Estimated Value
Home Financials for this Owner
Home Financials are based on the most recent Mortgage that was taken out on this home.
Original Mortgage
$151,000
Outstanding Balance
$126,843
Interest Rate
2.9%
Mortgage Type
New Conventional
Estimated Equity
$251,634
Purchase Details
Closed on
Apr 18, 2001
Sold by
Devano Dante
Bought by
Devano Belinda
Home Financials for this Owner
Home Financials are based on the most recent Mortgage that was taken out on this home.
Original Mortgage
$132,815
Interest Rate
6.98%
Mortgage Type
FHA
Purchase Details
Closed on
Mar 19, 2001
Sold by
Devano Belinda
Bought by
Young Elaine and Black Shaun
Home Financials for this Owner
Home Financials are based on the most recent Mortgage that was taken out on this home.
Original Mortgage
$132,815
Interest Rate
6.98%
Mortgage Type
FHA
Purchase Details
Closed on
Jun 5, 1995
Sold by
Devano Dante
Bought by
Devano Belinda
Home Financials for this Owner
Home Financials are based on the most recent Mortgage that was taken out on this home.
Original Mortgage
$102,250
Interest Rate
8.32%
Mortgage Type
FHA
Create a Home Valuation Report for This Property
The Home Valuation Report is an in-depth analysis detailing your home's value as well as a comparison with similar homes in the area
Home Values in the Area
Average Home Value in this Area
Purchase History
| Date | Buyer | Sale Price | Title Company |
|---|---|---|---|
| Black Shaun | -- | Wfg National Title Compan | |
| Devano Belinda | $134,900 | Fidelity National Title | |
| Young Elaine | $134,900 | Fidelity National Title | |
| Devano Belinda | -- | Nevada Title Company | |
| Devano Belinda | $103,500 | Nevada Title Company |
Source: Public Records
Mortgage History
| Date | Status | Borrower | Loan Amount |
|---|---|---|---|
| Open | Black Shaun | $151,000 | |
| Closed | Young Elaine | $132,815 | |
| Previous Owner | Devano Belinda | $102,250 |
Source: Public Records
Tax History Compared to Growth
Tax History
| Year | Tax Paid | Tax Assessment Tax Assessment Total Assessment is a certain percentage of the fair market value that is determined by local assessors to be the total taxable value of land and additions on the property. | Land | Improvement |
|---|---|---|---|---|
| 2025 | $1,247 | $73,140 | $28,000 | $45,140 |
| 2024 | $1,211 | $73,140 | $28,000 | $45,140 |
| 2023 | $886 | $73,354 | $30,450 | $42,904 |
| 2022 | $1,233 | $64,206 | $24,850 | $39,356 |
| 2021 | $1,142 | $58,473 | $21,000 | $37,473 |
| 2020 | $1,057 | $58,318 | $21,000 | $37,318 |
| 2019 | $991 | $54,468 | $17,500 | $36,968 |
| 2018 | $945 | $48,857 | $13,300 | $35,557 |
| 2017 | $1,643 | $48,985 | $12,950 | $36,035 |
| 2016 | $886 | $43,926 | $10,500 | $33,426 |
| 2015 | $883 | $32,904 | $7,000 | $25,904 |
| 2014 | $857 | $24,798 | $5,250 | $19,548 |
Source: Public Records
Map
Nearby Homes
- 3910 Cheryl Clay Way
- 3505 Benson Ln
- 3107 Atwater Dr
- 3629 Newton Falls St Unit 4
- 3609 Simmons St
- 3614 Newton Falls St
- 0 Simmons & Logan Unit 2721829
- 2801 Simmons Creek Ct
- 0 Simmons & Logan 2 Unit 2722091
- 3556 Valley Lily St
- Bellevue NextGen Plan at Simmance
- Skyland Plan at Simmance
- 3548 Valley Lily St
- 0 Simmons & Logan 3 Unit 2722103
- 3784 Nerine Pass Way
- 3809 Alpine Track Ave
- 3820 Alpine Track Ave
- 3937 Jamison Park Ln
- 3524 Silver Lantern Dr
- 3938 Redfield Ave
- 3925 Cheryl Clay Way
- 3924 Mineola Way
- 3921 Cheryl Clay Way
- 3920 Mineola Way Unit 15
- 3316 Gingersnap Way
- 3312 Gingersnap Way
- 3320 Gingersnap Way
- 3926 Cheryl Clay Way
- 3916 Mineola Way
- 3917 Cheryl Clay Way
- 3308 Gingersnap Way
- 3324 Gingersnap Way
- 3922 Cheryl Clay Way
- 3912 Mineola Way
- 3304 Gingersnap Way
- 3328 Gingersnap Way
- 3913 Cheryl Clay Way Unit 15
- 3908 Mineola Way
- 3925 Mineola Way
- 3404 Gingersnap Way