Estimated Value: $205,000 - $487,776
3
Beds
1
Bath
912
Sq Ft
$337/Sq Ft
Est. Value
About This Home
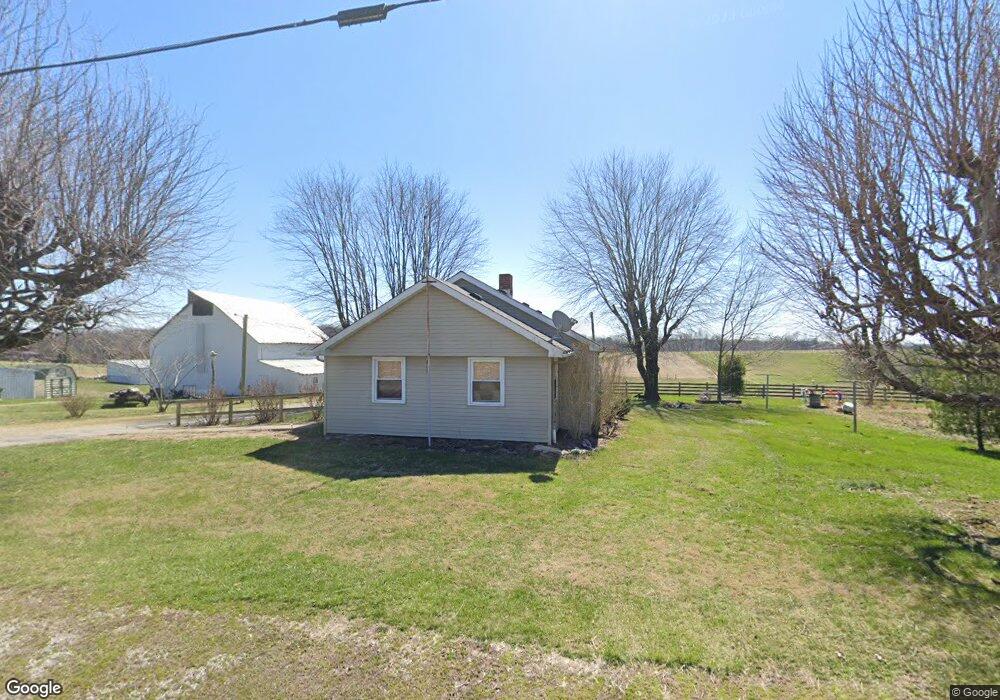
This home is located at 3929 E Quaker Rd, Salem, IN 47167 and is currently estimated at $307,592, approximately $337 per square foot. 3929 E Quaker Rd is a home located in Washington County with nearby schools including Bradie M. Shrum Lower Elementary School, Salem Middle School, and Salem High School.
Ownership History
Date
Name
Owned For
Owner Type
Purchase Details
Closed on
Apr 2, 2019
Sold by
Huffstutler Earl
Bought by
Mcginnis Kimel and Mcginnis Karen
Current Estimated Value
Purchase Details
Closed on
Jun 11, 2018
Sold by
Charles Lyles
Bought by
Lyles Charles E
Home Financials for this Owner
Home Financials are based on the most recent Mortgage that was taken out on this home.
Original Mortgage
$300,000
Interest Rate
4.5%
Mortgage Type
Closed End Mortgage
Purchase Details
Closed on
Jan 12, 2017
Sold by
Keeton Marsha and Lyles Paul E
Bought by
Keeton Marsha and Lyles David
Purchase Details
Closed on
Dec 29, 2009
Sold by
Lyles Paul E
Bought by
Lyles Paul E and Lyles Paul E
Create a Home Valuation Report for This Property
The Home Valuation Report is an in-depth analysis detailing your home's value as well as a comparison with similar homes in the area
Purchase History
| Date | Buyer | Sale Price | Title Company |
|---|---|---|---|
| Mcginnis Kimel | -- | None Available | |
| Lyles Charles E | $380,000 | -- | |
| Lyles Charles E | $380,000 | Salem Title Corp | |
| Keeton Marsha | -- | None Available | |
| Lyles Paul E | -- | None Available |
Source: Public Records
Mortgage History
| Date | Status | Borrower | Loan Amount |
|---|---|---|---|
| Previous Owner | Lyles Charles E | $300,000 |
Source: Public Records
Tax History
| Year | Tax Paid | Tax Assessment Tax Assessment Total Assessment is a certain percentage of the fair market value that is determined by local assessors to be the total taxable value of land and additions on the property. | Land | Improvement |
|---|---|---|---|---|
| 2025 | $3,781 | $246,300 | $147,400 | $98,900 |
| 2024 | $3,781 | $251,600 | $157,100 | $94,500 |
| 2023 | $4,544 | $226,100 | $134,300 | $91,800 |
| 2022 | $3,981 | $200,600 | $110,200 | $90,400 |
| 2021 | $3,571 | $174,300 | $97,500 | $76,800 |
| 2020 | $3,446 | $170,200 | $96,900 | $73,300 |
| 2019 | $3,701 | $184,600 | $113,700 | $70,900 |
| 2018 | $2,879 | $184,100 | $116,800 | $67,300 |
| 2017 | $3,056 | $197,900 | $131,200 | $66,700 |
| 2016 | $2,435 | $204,100 | $137,800 | $66,300 |
| 2014 | $2,271 | $207,400 | $143,200 | $64,200 |
| 2013 | $2,000 | $194,200 | $125,700 | $68,500 |
Source: Public Records
Map
Nearby Homes
- 4313 E Canton Rd
- 6430 E Old 56
- 1706 E Lewellen Rd
- 115 N Harristown Rd
- 707 Iroquois Blvd
- E E Old 56 Unit 4
- 532 Pilgrim Way
- 526 Pilgrim Way
- S S 160
- 705 N Heritage Chapel Tract 2 Rd
- TBD E Old St Rd 56
- 130 E Eastern Hills Blvd
- 107 Walker Blvd
- 905 Locust St
- 901 N College Ave
- 115 Nichols Ave
- 8091 E New Philadelphia Rd
- 1440 S Jackson St
- 2018 N Sparks Ferry Rd
- 509 N High St
- 3803 E Quaker Rd
- 4145 E Quaker Rd
- 3755 E Quaker Rd
- 4225 E Quaker Rd
- 4247 E Quaker Rd
- 4234 E Quaker Rd
- 4287 E Quaker Rd
- 3681 E Quaker Rd
- 0 Quaker Unit 26051
- 0 Quaker Unit 26998
- 4522 E Quaker Rd
- 4593 E Quaker Rd
- 4472 E Broadway Rd
- 3243 N Marrs Rd
- 3477 E Quaker Rd
- 4347 E Broadway Rd
- 3385 N Trueblood Ln
- 4739 E Quaker Rd
- 4182 E Broadway Rd
- 4182 E Broadway Rd
Your Personal Tour Guide
Ask me questions while you tour the home.