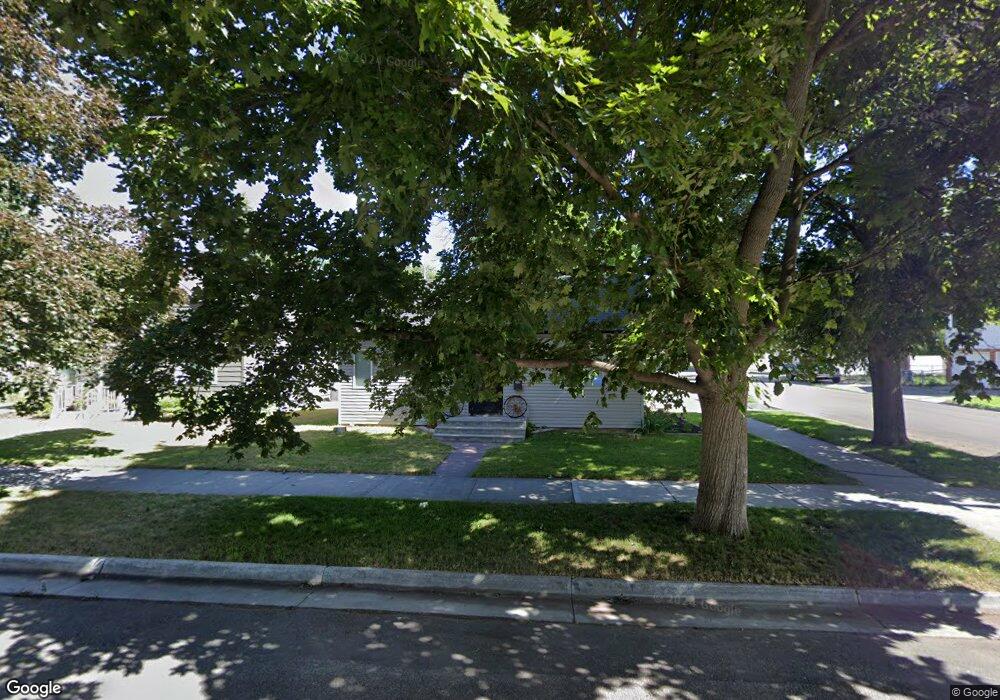
393 11th St Idaho Falls, ID 83404
Estimated Value: $256,000 - $298,000
3
Beds
2
Baths
1,016
Sq Ft
$276/Sq Ft
Est. Value
About This Home
This home is located at 393 11th St, Idaho Falls, ID 83404 and is currently estimated at $280,082, approximately $275 per square foot. 393 11th St is a home located in Bonneville County with nearby schools including Hawthorne Elementary School, Taylorview Middle School, and Idaho Falls Senior High School.
Ownership History
Date
Name
Owned For
Owner Type
Purchase Details
Closed on
Jun 21, 2017
Sold by
Nygard David and Nygard Marilyn
Bought by
Sheeley Daniel
Current Estimated Value
Home Financials for this Owner
Home Financials are based on the most recent Mortgage that was taken out on this home.
Original Mortgage
$82,200
Outstanding Balance
$56,056
Interest Rate
4.05%
Mortgage Type
Purchase Money Mortgage
Estimated Equity
$224,026
Purchase Details
Closed on
May 16, 2017
Sold by
Bonneville County Prosecuting Attorney
Bought by
Nygard David and Nygard Marilyn
Home Financials for this Owner
Home Financials are based on the most recent Mortgage that was taken out on this home.
Original Mortgage
$82,200
Outstanding Balance
$56,056
Interest Rate
4.05%
Mortgage Type
Purchase Money Mortgage
Estimated Equity
$224,026
Create a Home Valuation Report for This Property
The Home Valuation Report is an in-depth analysis detailing your home's value as well as a comparison with similar homes in the area
Home Values in the Area
Average Home Value in this Area
Purchase History
| Date | Buyer | Sale Price | Title Company |
|---|---|---|---|
| Sheeley Daniel | -- | First American Title Idaho F | |
| Nygard David | -- | None Available |
Source: Public Records
Mortgage History
| Date | Status | Borrower | Loan Amount |
|---|---|---|---|
| Open | Sheeley Daniel | $82,200 |
Source: Public Records
Tax History Compared to Growth
Tax History
| Year | Tax Paid | Tax Assessment Tax Assessment Total Assessment is a certain percentage of the fair market value that is determined by local assessors to be the total taxable value of land and additions on the property. | Land | Improvement |
|---|---|---|---|---|
| 2025 | $1,440 | $351,329 | $64,078 | $287,251 |
| 2024 | $1,440 | $332,486 | $44,180 | $288,306 |
| 2023 | $1,242 | $270,952 | $44,180 | $226,772 |
| 2022 | $1,517 | $230,301 | $30,141 | $200,160 |
| 2021 | $886 | $162,853 | $30,141 | $132,712 |
| 2019 | $1,024 | $111,486 | $25,125 | $86,361 |
| 2018 | $957 | $111,845 | $22,859 | $88,986 |
| 2017 | $42 | $99,128 | $16,625 | $82,503 |
| 2016 | $828 | $0 | $0 | $0 |
| 2015 | $400 | $82,741 | $15,102 | $67,639 |
| 2014 | $22,425 | $82,741 | $15,102 | $67,639 |
| 2013 | $776 | $82,812 | $15,101 | $67,711 |
Source: Public Records
Map
Nearby Homes