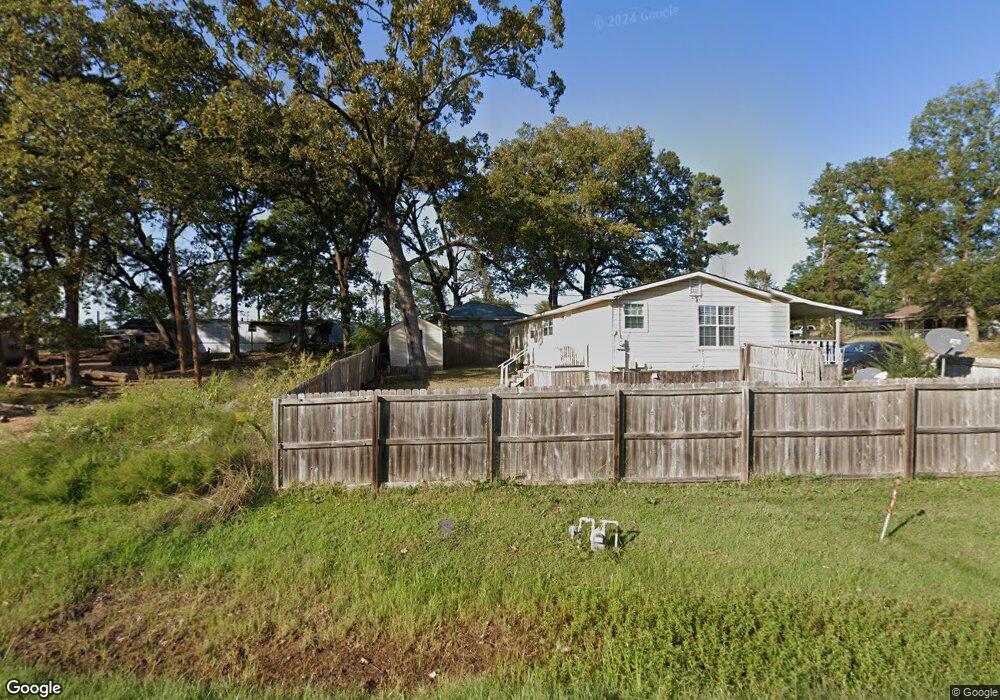
393 Bodcau Station Rd Haughton, LA 71037
Estimated Value: $83,950 - $128,000
3
Beds
1
Bath
1,085
Sq Ft
$97/Sq Ft
Est. Value
About This Home
This home is located at 393 Bodcau Station Rd, Haughton, LA 71037 and is currently estimated at $105,738, approximately $97 per square foot. 393 Bodcau Station Rd is a home located in Bossier Parish with nearby schools including T.L. Rodes Elementary School, Platt Elementary School, and Princeton Elementary School.
Ownership History
Date
Name
Owned For
Owner Type
Purchase Details
Closed on
Jun 8, 2018
Sold by
Tabor Shawn M
Bought by
Parnell Aaron W and Kay-Parnell Leslie
Current Estimated Value
Home Financials for this Owner
Home Financials are based on the most recent Mortgage that was taken out on this home.
Original Mortgage
$98,090
Outstanding Balance
$87,068
Interest Rate
5.75%
Mortgage Type
FHA
Estimated Equity
$18,670
Purchase Details
Closed on
Dec 21, 2016
Sold by
Castle 2016 Llc
Bought by
Tabor Shawn Michelle
Purchase Details
Closed on
Sep 2, 2011
Sold by
Roberts Wesley Ryan and Roberts Sandra Leann Dempsey
Bought by
Brown Steven Lee
Home Financials for this Owner
Home Financials are based on the most recent Mortgage that was taken out on this home.
Original Mortgage
$75,944
Interest Rate
4.43%
Mortgage Type
New Conventional
Create a Home Valuation Report for This Property
The Home Valuation Report is an in-depth analysis detailing your home's value as well as a comparison with similar homes in the area
Home Values in the Area
Average Home Value in this Area
Purchase History
| Date | Buyer | Sale Price | Title Company |
|---|---|---|---|
| Parnell Aaron W | $99,900 | -- | |
| Tabor Shawn Michelle | $29,900 | None Available | |
| Brown Steven Lee | $49,189 | None Available |
Source: Public Records
Mortgage History
| Date | Status | Borrower | Loan Amount |
|---|---|---|---|
| Open | Parnell Aaron W | $98,090 | |
| Previous Owner | Brown Steven Lee | $75,944 |
Source: Public Records
Tax History Compared to Growth
Tax History
| Year | Tax Paid | Tax Assessment Tax Assessment Total Assessment is a certain percentage of the fair market value that is determined by local assessors to be the total taxable value of land and additions on the property. | Land | Improvement |
|---|---|---|---|---|
| 2024 | $36 | $4,707 | $100 | $4,607 |
| 2023 | $36 | $4,118 | $100 | $4,018 |
| 2022 | $36 | $4,118 | $100 | $4,018 |
| 2021 | $36 | $4,118 | $100 | $4,018 |
| 2020 | $36 | $4,118 | $100 | $4,018 |
| 2019 | $36 | $4,713 | $100 | $4,613 |
| 2018 | $36 | $4,713 | $100 | $4,613 |
| 2017 | $472 | $3,580 | $100 | $3,480 |
| 2016 | $472 | $3,580 | $100 | $3,480 |
| 2015 | $36 | $3,950 | $100 | $3,850 |
| 2014 | $36 | $3,950 | $100 | $3,850 |
Source: Public Records
Map
Nearby Homes
- 121 Casa Dr
- 809 Princesa Dr
- 228 Bodcau Station Rd
- 2 Woodfern Ln
- 305 Hacienda Cir
- 202 Espanita Blvd
- 0 Bodcau Station Rd Unit 21132913
- 92 S Meadow Ln
- 109 S Meadow Ln
- 129 Chimney Ln
- 222 Country Ln
- 108 Deerwood Ln
- 1152 Green Wood Cir
- 1154 Green Wood Cir
- 346 Wood Springs
- 137 Elmview Ln
- 334 Wood Springs
- 145 Elmview Ln
- 403 Blackwood Cir
- 304 Peachwood Cir
- 389 Bodcau Station Rd
- 391 Bodcau Station Rd
- 403 Bodcau Station Rd
- 422 Bodcau Station Rd
- 362 Young Rd
- 368 Bodcau Station Rd
- 903 Villa Ln
- 905 Villa Ln
- 909 Villa Ln
- 911 Villa Ln
- 2030 Highway 80 Unit C
- 2030 Highway 80 Unit B
- 2030 Highway 80 Unit 107
- 2030 Highway 80 Unit 106
- 2030 Highway 80 Unit 105
- 2030 Highway 80 Unit 103
- 2030 Highway 80 Unit 114
- 2030 Highway 80 Unit 113
- 2030 Highway 80 Unit 112
- 2030 Highway 80 Unit 111