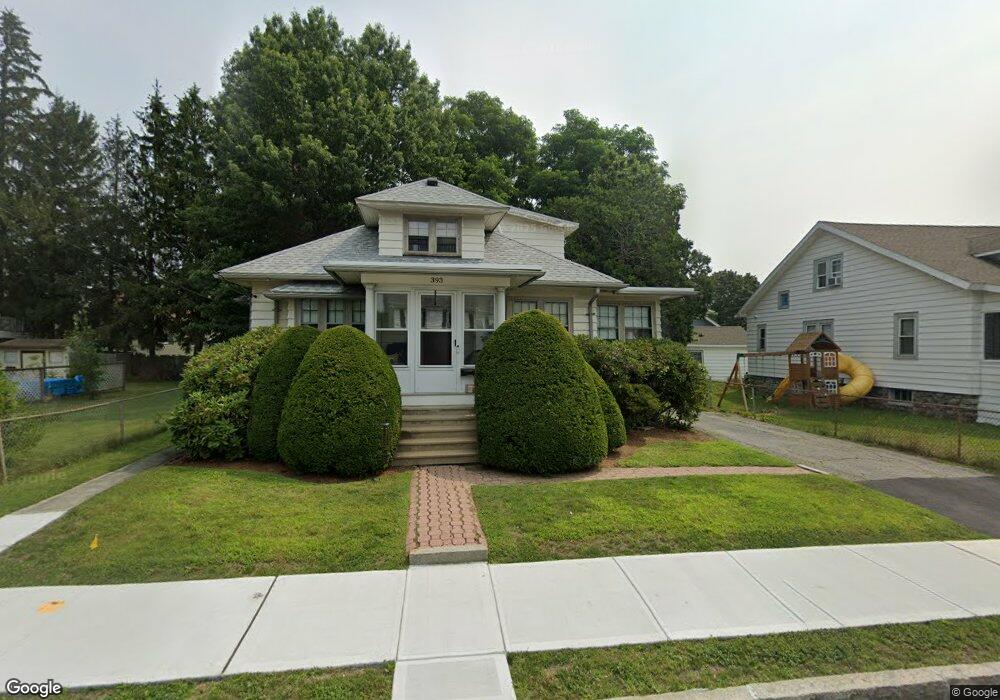
393 Burncoat St Worcester, MA 01606
Burncoat NeighborhoodEstimated Value: $437,625 - $465,000
4
Beds
2
Baths
1,382
Sq Ft
$323/Sq Ft
Est. Value
About This Home
This home is located at 393 Burncoat St, Worcester, MA 01606 and is currently estimated at $446,906, approximately $323 per square foot. 393 Burncoat St is a home located in Worcester County with nearby schools including Belmont Street Community School, Jacob Hiatt Magnet School, and Chandler Magnet.
Ownership History
Date
Name
Owned For
Owner Type
Purchase Details
Closed on
Mar 13, 1998
Sold by
Fitzgerald Mark E and Fitzgerald Julianne D
Bought by
Mcgovern James P and Mcgovern Lisa M
Current Estimated Value
Home Financials for this Owner
Home Financials are based on the most recent Mortgage that was taken out on this home.
Original Mortgage
$84,800
Interest Rate
7.03%
Mortgage Type
Purchase Money Mortgage
Purchase Details
Closed on
Oct 1, 1991
Sold by
Est Margaret Donahue
Bought by
Fitzgerald Mark E and Julianne Fitzgerald
Home Financials for this Owner
Home Financials are based on the most recent Mortgage that was taken out on this home.
Original Mortgage
$77,400
Interest Rate
9.1%
Mortgage Type
Purchase Money Mortgage
Create a Home Valuation Report for This Property
The Home Valuation Report is an in-depth analysis detailing your home's value as well as a comparison with similar homes in the area
Home Values in the Area
Average Home Value in this Area
Purchase History
| Date | Buyer | Sale Price | Title Company |
|---|---|---|---|
| Mcgovern James P | $106,000 | -- | |
| Fitzgerald Mark E | $86,000 | -- |
Source: Public Records
Mortgage History
| Date | Status | Borrower | Loan Amount |
|---|---|---|---|
| Open | Fitzgerald Mark E | $85,000 | |
| Closed | Fitzgerald Mark E | $84,800 | |
| Previous Owner | Fitzgerald Mark E | $81,800 | |
| Previous Owner | Fitzgerald Mark E | $77,400 |
Source: Public Records
Tax History Compared to Growth
Tax History
| Year | Tax Paid | Tax Assessment Tax Assessment Total Assessment is a certain percentage of the fair market value that is determined by local assessors to be the total taxable value of land and additions on the property. | Land | Improvement |
|---|---|---|---|---|
| 2025 | $4,631 | $351,100 | $102,900 | $248,200 |
| 2024 | $4,520 | $328,700 | $102,900 | $225,800 |
| 2023 | $4,351 | $303,400 | $89,400 | $214,000 |
| 2022 | $3,983 | $261,900 | $71,600 | $190,300 |
| 2021 | $3,862 | $237,200 | $57,300 | $179,900 |
| 2020 | $3,771 | $221,800 | $57,300 | $164,500 |
| 2019 | $3,555 | $197,500 | $51,500 | $146,000 |
| 2018 | $3,529 | $186,600 | $51,500 | $135,100 |
| 2017 | $3,404 | $177,100 | $51,500 | $125,600 |
| 2016 | $3,421 | $166,000 | $38,600 | $127,400 |
| 2015 | $3,332 | $166,000 | $38,600 | $127,400 |
| 2014 | $3,244 | $166,000 | $38,600 | $127,400 |
Source: Public Records
Map
Nearby Homes
- 10 Arbutus Rd
- 68 Housatonic St
- 37 Uncatena Ave
- 14 Housatonic St
- 323 Burncoat St
- 1 Purchase St
- 49 Prudential Rd
- 55 Prudential Rd
- 131 Airlie St
- 92 Blue Bell Rd
- 314 Burncoat St
- 80 Prudential Rd
- 40 Francis St
- 14 Fales St
- 18 Danielles Way
- 30 Danielles Way
- 29 E Mountain
- 2 Maria Ln Unit 2
- 13 Fatima Ln
- 58 Airlie St