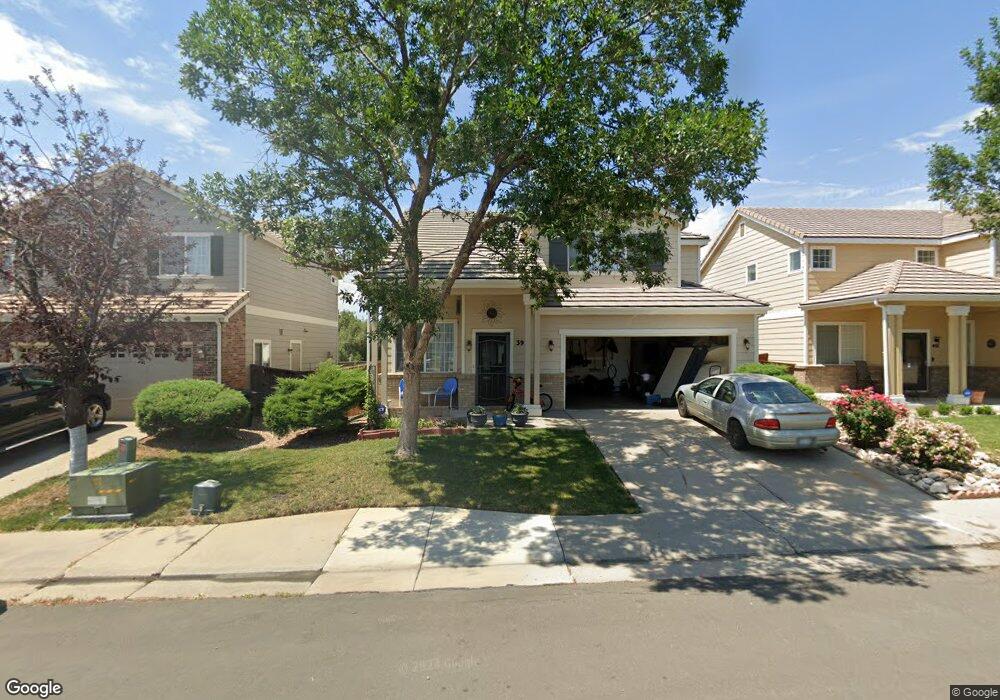
393 Chambers Way Aurora, CO 80011
Centretech NeighborhoodEstimated Value: $454,000 - $481,000
2
Beds
3
Baths
1,582
Sq Ft
$297/Sq Ft
Est. Value
About This Home
This home is located at 393 Chambers Way, Aurora, CO 80011 and is currently estimated at $470,544, approximately $297 per square foot. 393 Chambers Way is a home located in Arapahoe County with nearby schools including Edna & John W. Mosley P-8, Hinkley High School, and Montessori Del Mundo Charter School.
Ownership History
Date
Name
Owned For
Owner Type
Purchase Details
Closed on
Jan 23, 2020
Sold by
Ontrack Land Llc
Bought by
Harris Dionne M
Current Estimated Value
Home Financials for this Owner
Home Financials are based on the most recent Mortgage that was taken out on this home.
Original Mortgage
$348,570
Outstanding Balance
$313,092
Interest Rate
4.5%
Mortgage Type
FHA
Estimated Equity
$157,452
Purchase Details
Closed on
Oct 2, 2019
Sold by
Nrv Ltd
Bought by
Ontrack Land Llc
Home Financials for this Owner
Home Financials are based on the most recent Mortgage that was taken out on this home.
Original Mortgage
$239,275
Interest Rate
3.5%
Mortgage Type
Commercial
Purchase Details
Closed on
Dec 20, 2002
Sold by
Richmond American Homes Of Colorado Inc
Bought by
Murry Lona Kay
Home Financials for this Owner
Home Financials are based on the most recent Mortgage that was taken out on this home.
Original Mortgage
$226,029
Interest Rate
5.96%
Mortgage Type
FHA
Create a Home Valuation Report for This Property
The Home Valuation Report is an in-depth analysis detailing your home's value as well as a comparison with similar homes in the area
Home Values in the Area
Average Home Value in this Area
Purchase History
| Date | Buyer | Sale Price | Title Company |
|---|---|---|---|
| Harris Dionne M | $355,000 | Canyon Title | |
| Ontrack Land Llc | $281,500 | Assured Title Agency | |
| Nurv Ltd | $245,000 | Ascendant Title Co | |
| Murry Lona Kay | $229,577 | -- |
Source: Public Records
Mortgage History
| Date | Status | Borrower | Loan Amount |
|---|---|---|---|
| Open | Harris Dionne M | $348,570 | |
| Previous Owner | Ontrack Land Llc | $239,275 | |
| Previous Owner | Murry Lona Kay | $226,029 |
Source: Public Records
Tax History Compared to Growth
Tax History
| Year | Tax Paid | Tax Assessment Tax Assessment Total Assessment is a certain percentage of the fair market value that is determined by local assessors to be the total taxable value of land and additions on the property. | Land | Improvement |
|---|---|---|---|---|
| 2024 | $3,065 | $32,977 | -- | -- |
| 2023 | $3,065 | $32,977 | $0 | $0 |
| 2022 | $2,476 | $24,659 | $0 | $0 |
| 2021 | $2,556 | $24,659 | $0 | $0 |
| 2020 | $2,280 | $21,893 | $0 | $0 |
| 2019 | $2,267 | $21,893 | $0 | $0 |
| 2018 | $1,998 | $18,893 | $0 | $0 |
| 2017 | $1,738 | $18,893 | $0 | $0 |
| 2016 | $1,547 | $16,470 | $0 | $0 |
| 2015 | $1,494 | $16,470 | $0 | $0 |
| 2014 | $991 | $10,524 | $0 | $0 |
| 2013 | -- | $13,010 | $0 | $0 |
Source: Public Records
Map
Nearby Homes
- 141 Granby Way Unit A
- 608 Evanston St
- 48 S Evanston Way
- 14794 E 2nd Ave Unit 111F
- 15950 E 6th Ave
- 14806 E 2nd Ave Unit 311G
- 14806 E 2nd Ave Unit 105G
- 14806 E 2nd Ave Unit 106G
- 14704 E 2nd Ave Unit 300E
- 14704 E 2nd Ave Unit 305E
- 731 Elkhart St
- 622 Dawson St
- 14602 E 2nd Ave Unit 100C
- 14602 E 2nd Ave Unit 110C
- 14602 E 2nd Ave Unit 108C
- 46 S Eagle Cir
- 14500 E 2nd Ave Unit 209A
- 713 Kittredge Ct
- 808 Idalia St
- 1575 N Sable Blvd
- 383 Chambers Way
- 401 Chambers Way
- 373 Chambers Way
- 411 Chambers Way
- 384 Chambers Way
- 402 Chambers Way
- 363 Chambers Way
- 413 Chambers Way
- 374 Chambers Way
- 412 Chambers Way
- 305 Ivory Cir
- 364 Chambers Way
- 409 Ivory Cir
- 421 Chambers Way
- 307 Ivory Cir
- 407 Ivory Cir
- 422 Chambers Way
- 309 Ivory Cir
- 405 Ivory Cir
- 319 Ivory Cir