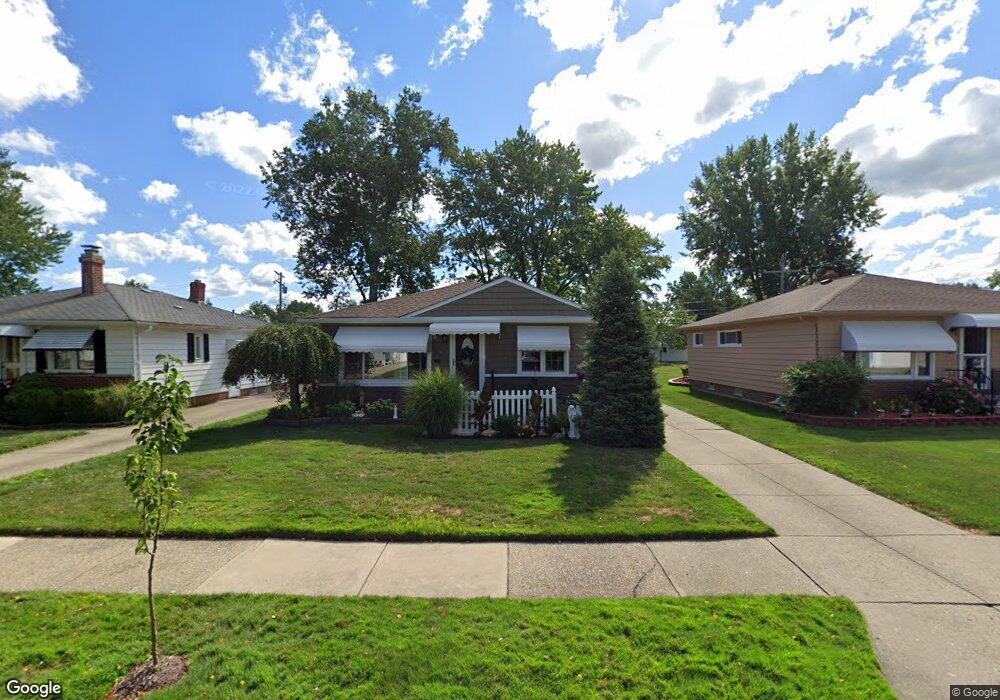
393 Divot Dr Willowick, OH 44095
Estimated Value: $200,000 - $207,000
3
Beds
2
Baths
1,064
Sq Ft
$191/Sq Ft
Est. Value
About This Home
This home is located at 393 Divot Dr, Willowick, OH 44095 and is currently estimated at $203,672, approximately $191 per square foot. 393 Divot Dr is a home located in Lake County with nearby schools including Royalview Elementary School, Willowick Middle School, and North High School.
Ownership History
Date
Name
Owned For
Owner Type
Purchase Details
Closed on
Aug 16, 2002
Sold by
Englehart Susan
Bought by
Adams Steven E and Adams Gayle A
Current Estimated Value
Home Financials for this Owner
Home Financials are based on the most recent Mortgage that was taken out on this home.
Original Mortgage
$112,400
Outstanding Balance
$46,029
Interest Rate
6.64%
Estimated Equity
$157,643
Purchase Details
Closed on
Aug 7, 2002
Sold by
Brancatelli Janet L
Bought by
Adams Steven E and Adams Gayle A
Home Financials for this Owner
Home Financials are based on the most recent Mortgage that was taken out on this home.
Original Mortgage
$112,400
Outstanding Balance
$46,029
Interest Rate
6.64%
Estimated Equity
$157,643
Purchase Details
Closed on
Nov 27, 2001
Sold by
Anne Englehart
Bought by
Brancatelli Janet L and Englehart James R
Purchase Details
Closed on
Jan 1, 1990
Bought by
Englehart Anne
Create a Home Valuation Report for This Property
The Home Valuation Report is an in-depth analysis detailing your home's value as well as a comparison with similar homes in the area
Home Values in the Area
Average Home Value in this Area
Purchase History
| Date | Buyer | Sale Price | Title Company |
|---|---|---|---|
| Adams Steven E | -- | Equity Title Agency Inc | |
| Adams Steven E | $124,900 | Equity Title Agency Inc | |
| Brancatelli Janet L | -- | -- | |
| Englehart Anne | -- | -- |
Source: Public Records
Mortgage History
| Date | Status | Borrower | Loan Amount |
|---|---|---|---|
| Open | Adams Steven E | $112,400 |
Source: Public Records
Tax History
| Year | Tax Paid | Tax Assessment Tax Assessment Total Assessment is a certain percentage of the fair market value that is determined by local assessors to be the total taxable value of land and additions on the property. | Land | Improvement |
|---|---|---|---|---|
| 2025 | -- | $73,650 | $15,150 | $58,500 |
| 2024 | -- | $73,650 | $15,150 | $58,500 |
| 2023 | -- | $48,340 | $12,380 | $35,960 |
| 2022 | $3,484 | $48,340 | $12,380 | $35,960 |
| 2021 | $3,498 | $48,340 | $12,380 | $35,960 |
| 2020 | $3,264 | $40,960 | $10,490 | $30,470 |
| 2019 | $3,059 | $40,960 | $10,490 | $30,470 |
| 2018 | $3,024 | $44,510 | $14,960 | $29,550 |
| 2017 | $3,436 | $44,510 | $14,960 | $29,550 |
| 2016 | $3,430 | $44,510 | $14,960 | $29,550 |
| 2015 | $3,373 | $44,510 | $14,960 | $29,550 |
| 2014 | $3,224 | $44,510 | $14,960 | $29,550 |
| 2013 | $3,225 | $44,510 | $14,960 | $29,550 |
Source: Public Records
Map
Nearby Homes
- 29070 W Willowick Dr
- 311 E 293rd St
- 30008 Mildred Dr
- 30102 Mildred Dr
- 294 Lakewick Ln
- 30002 Barjode Rd
- 300 Lakewick Ln
- 28759 Forest Rd
- 346 Lakewick Ln
- 375 Beechwood Dr
- 30325 Mildred Dr
- 30408 Mildred Dr
- 518 E 305th St
- 29520 Bruce Dr
- 459 Cole Plaza
- 29966 Elgin Rd
- 30104 Warren Rd
- 29008 Uxbridge Dr
- 30224 Regent Rd
- 29007 Uxbridge Dr
Your Personal Tour Guide
Ask me questions while you tour the home.